



Most inventory forecasting frameworks assume you've got years of clean data, consistent seasonality, and a dedicated analyst running regression models. Meanwhile, you're sitting there with 12 weeks of sales history, half your SKUs launched mid-year, and your "forecasting tool" is whatever Excel formula you copied from a YouTube video.
This gap destroys cash flow. The academic forecasting methods everyone teaches simply don't work when you're dealing with limited data, irregular ordering patterns, and the reality that your biggest customer might disappear tomorrow.
What actually works is a lightweight, repeatable framework built specifically for businesses operating with minimal historical data. Not the textbook version. The real version that accounts for data gaps, handles uncertainty, and actually gets used week after week.
Why Traditional Forecasting Breaks for Small Businesses
The fundamental problem isn't that small businesses are bad at forecasting. It's that conventional forecasting methods were built for companies with predictable demand patterns and extensive historical data.
Take moving averages. Everyone tells you to use a 12-month rolling average for baseline demand. Great advice if you've been selling the same products for three years. Completely useless when half your catalog is less than six months old and your bestseller just went viral on TikTok last Tuesday.
Statistical models have the same issue. They need clean, consistent data to identify patterns. But small business data is messy. You've got stockouts that artificially suppress demand. Price changes that spike sales temporarily. That one wholesale order that makes October look like Christmas. Your data tells stories, but they're not the neat, linear narratives that forecasting models expect.
The bigger challenge is operational reality. Enterprise forecasting happens in dedicated planning meetings with cross-functional teams. Small business forecasting happens Tuesday morning between handling customer emails and figuring out why the shipping software crashed again. You need something that works in 30 minutes, not three hours.
The Compact Framework: Built for Real Operations
Instead of forcing academic methods onto chaotic small business data, this framework starts with what you actually have and builds from there.
Never run out of stock or overorder again.
Listoly streamlines inventory workflows to keep your business stocked and profitable.
- Real-time stock tracking
- Automated reorder alerts
- Supplier and purchase management
No credit card required
The core principle: use multiple simple forecasts instead of one complex model. Each method captures different aspects of demand. When they agree, you've got confidence. When they diverge, you know where to dig deeper.
Required Inputs (The Realistic Version)
-
Sales velocity by SKU - Last 4, 8, and 12 weeks of unit sales (or whatever you have)
-
Current inventory position - On-hand, on-order, and committed stock
-
Lead time ranges - Not the supplier's promise. Your actual receiving history.
-
Constraint flags - MOQs, case packs, storage limits, cash available for inventory
-
Context markers - Promotions, stockouts, new launches, or anything that makes historical data unreliable
That's it. No complex demand signals, no market analysis. Just the operational data you already track.
Notice what's not on that list: years of history, seasonal coefficients, or advanced analytics. This framework works whether you have three months or three years of data.
The Three-Method Approach
Method 1: Velocity-Based Projection
Take your recent sales rate and project it forward. The key is using multiple timeframes and weighting them based on data quality.
For items with decent history:
-
70% weight on last 4 weeks
-
20% weight on last 8 weeks
-
10% weight on last 12 weeks
For newer items (less than 8 weeks of data):
-
100% weight on available weeks
-
Apply a 1.3x growth multiplier for the first 12 weeks (new items typically accelerate)
For items with stockout periods:
-
Exclude stockout weeks entirely
-
Inflate remaining weeks by estimated lost sales (usually 15-25% depending on product type)
Method 2: Order Pattern Recognition
Look at customer order patterns, not just total units. This catches lumpy demand that averages miss.
-
Singles (1 unit orders)
-
Small multiples (2-5 units)
-
Bulk orders (6+ units)
Calculate frequency for each group. If you sell 100 units monthly but it's all single-unit orders, that's different from selling 100 units via five 20-unit orders. The first suggests consistent retail demand. The second suggests wholesale or B2B activity that might not repeat monthly.
Method 3: Coverage Target Calculation
Work backwards from how many days of coverage you want, adjusted for lead time variability.
Target Coverage = Lead Time + Safety Buffer + Review Period
-
High confidence (stable sales, good history)
7-10 days buffer
-
Medium confidence (some variability)
14-21 days buffer
-
Low confidence (new item, irregular pattern)
28+ days buffer
Combining the Signals
Run all three methods, then compare. If all three suggest similar quantities (within about 20%), use the average. You've got a solid forecast.
If velocity projection is way higher than coverage target, check for recent spikes — a promotion or seasonal bump might be skewing things.
If order pattern recognition shows bulk orders driving demand, flag that SKU for direct customer outreach. Those bulk buyers might actually tell you when they're ordering next.
When the methods disagree significantly (more than 40% variance), that's valuable information. Your demand pattern is unstable and you need higher safety stock or more frequent review.
Forecast Cadence That Actually Happens
The academic answer is "forecast continuously." The real answer is you'll forecast when you have time and remember to do it.
Build a rhythm that matches your ordering cycle:
-
Weekly Items (fast movers) Every Monday morning, 15-minute velocity check. Just run Method 1, compare to on-hand, decide if you need to order.
-
Bi-weekly Items (steady sellers) Every other Thursday, 30-minute full framework review. Run all three methods, adjust for upcoming promotions.
-
Monthly Items (slow movers) First week of the month, 45-minute deep dive. Full framework plus manual review of any unusual patterns.
-
Quarterly Items (seasonal or sporadic) Don't forecast. Set reorder points and check quarterly. The framework breaks down when demand is too intermittent.
Consistency matters more than complexity. A simple forecast done every week beats a sophisticated model run sporadically.
Error Tracking Without Statistical Degrees
Traditional error tracking involves MAPE calculations, bias adjustments, and accuracy dashboards. Here's what actually works when you're running lean.
Track just two metrics:
-
Stockout incidents How many times did you run out? Not percentage, not lost sales analysis. Just count incidents.
-
Excess weeks For each overstock situation, how many weeks of excess did you carry?
Every month, list your five worst forecasts — biggest stockouts and biggest overstock situations. For each, write one sentence about what went wrong. This simple exercise builds pattern recognition faster than any metric dashboard.
Patterns you'll likely spot over time:
-
New items accelerate faster than expected in weeks 3-6
-
Bulk orders from specific customers aren't actually recurring
-
Price increases kill demand more than projected
-
Social media mentions create temporary spikes that flatten out quickly
Build a simple adjustment table from those patterns:
| Scenario | Forecast Adjustment |
|---|---|
| New item, weeks 1-4 | +30% to velocity |
| Recent bulk order | Exclude from velocity calc |
| Price increase >15% | -25% to forecast |
| Social mention spike | Cap at 2x normal velocity |
| Entering slow season | -40% to forecast |
Once you've got a few months of error data, these adjustments stop being guesses and start being grounded in what your specific business actually does.
Escalation Rules and Decision Points
The framework needs clear triggers for when to override the numbers. Small businesses can't afford to blindly follow formulas.
Immediate Overrides:
-
Forecast suggests ordering below MOQ → Round up or skip this cycle
-
Forecast exceeds cash available → Order to cash limit, flag for review
-
Forecast exceeds storage capacity → Order to capacity, schedule clearance
-
Customer confirms large upcoming order → Add confirmed quantity to forecast
Escalation Triggers:
-
When forecast variance between methods exceeds 50%
Manual review required. Check for data errors, recent changes, or unusual patterns.
-
When suggested order is 3x larger than usual
Verify the calculation, check for promotion impacts, consider phased ordering.
-
When forecast drops below 20% of recent average
Investigate immediately. Could be a data problem, competitive pressure, or shifting demand.
-
When a new item forecast seems unrealistic
Compare to similar product launches. New items are hard to forecast but usually follow category patterns.
The "Smell Test" Override:
Sometimes the numbers are technically correct but operationally wrong. If the forecast suggests ordering 500 units of something you normally sell 50 of monthly, stop and investigate. Trust operational instinct over mathematical output.
Downloadable Templates and Examples
A practical template structure that works in basic Excel or Google Sheets:
-
Tab 1
Data Input
- Columns: SKU, Week 1-12 Sales, On-Hand, On-Order, Lead Time, MOQ, Notes - Keep it simple. Don't add fields you won't maintain. -
Tab 2
Three-Method Calc
- Velocity forecast (with multiple timeframe weights) - Order pattern buckets (singles, multiples, bulk) - Coverage targets (based on confidence levels) - Variance flags when methods disagree -
Tab 3
Decision Output
- Suggested order quantity (averaged or selected from methods) - Constraint adjustments (MOQ, cash, storage) - Confidence indicator (high/medium/low based on variance) - Override notes field -
Tab 4
Error Tracking
- Simple list: Date, SKU, Forecast, Actual, Variance, Note - Monthly summary of biggest misses - Running adjustment factors by category
The template should take about 5 minutes to update for 20 SKUs, maybe 15 minutes for 50. If it's taking longer, you're tracking too much.
Real Scenario: Outdoor Gear Retailer
A small outdoor gear shop implemented this framework with 180 SKUs and roughly 14 months of partial sales history. Previously, they were doing pure gut-feel ordering, which meant constant stockouts on popular items and around $45,000 tied up in slow-moving inventory.
Month 1: Set up the framework, ran first forecasts. Immediately identified 12 items they were consistently under-ordering and 23 items severely overstocked.
Month 2: Started weekly forecasting for their top 20 items, bi-weekly for the next 40, monthly for everything else. Stockouts on fast-movers dropped from 8-10 monthly incidents to 2-3.
Month 3: Added error tracking. Discovered their camping gear had a hidden demand pattern — bulk orders from scout troops that looked random but actually followed school calendar timing.
Month 6: Reduced inventory investment by roughly $12,000 while maintaining better in-stock rates. Cash flow improved enough to fund two new product lines.
It wasn't perfect. They still missed some seasonal transitions and a couple of new product launches went sideways. But having a systematic approach meant problems got caught faster and patterns became visible over time.
The Forecasting Workflow in Practice
Understanding how the pieces connect matters as much as the individual steps. Here's how a typical weekly review cycle flows from data pull to order decision:
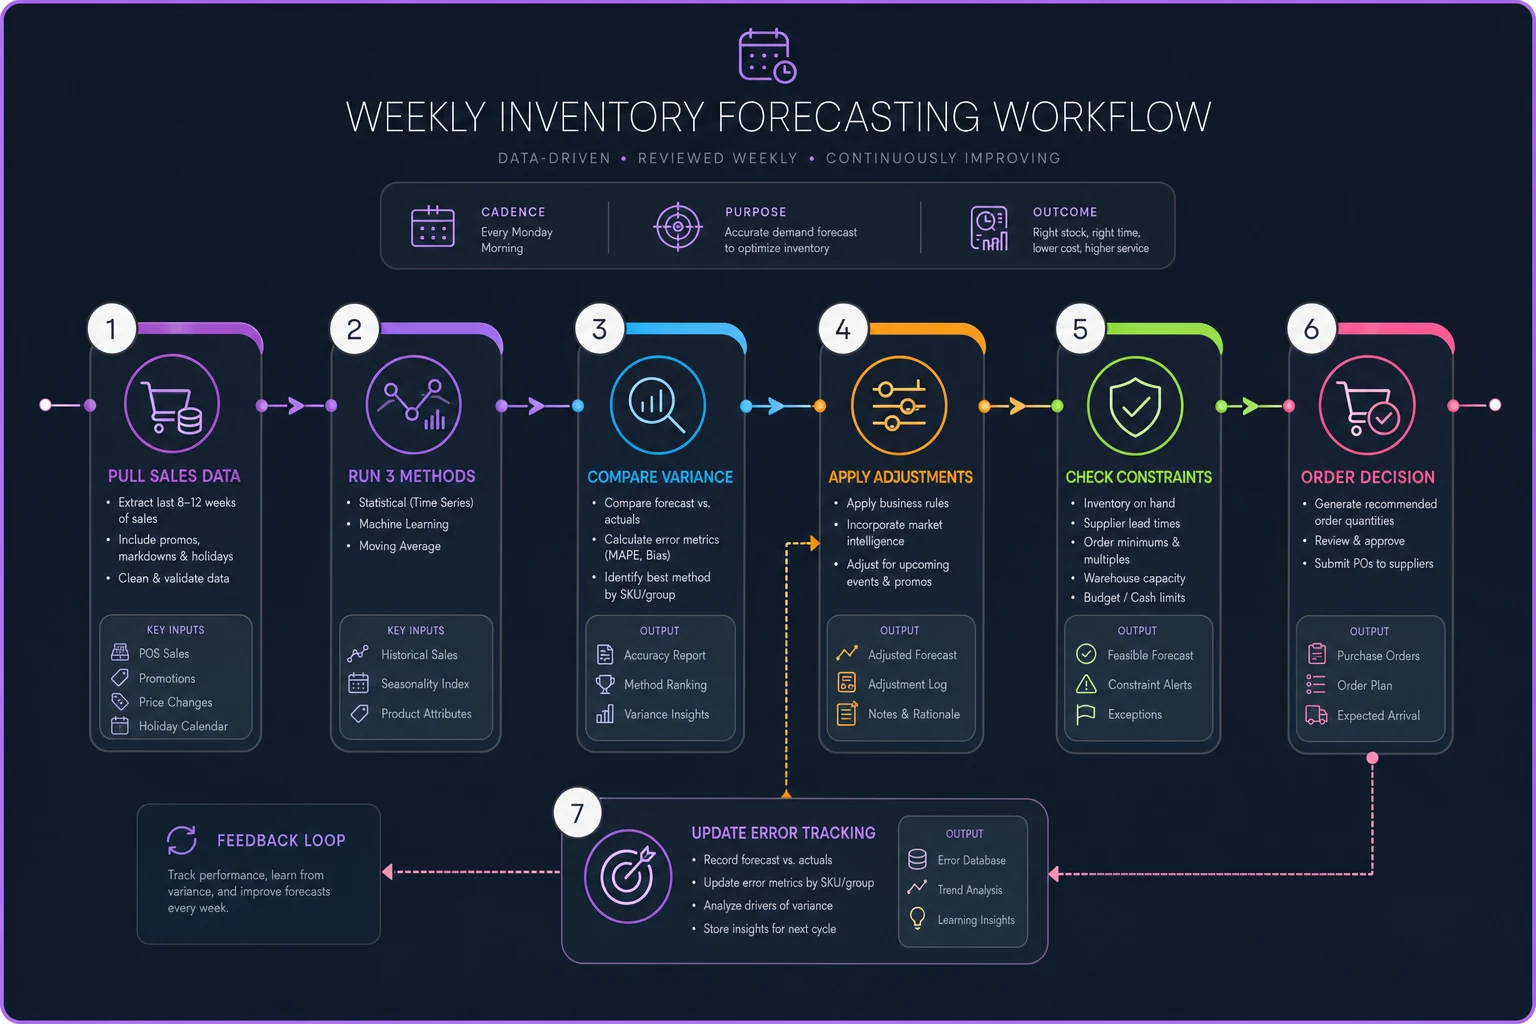
The loop matters. Error tracking feeds back into your adjustment table, which improves the next round of forecasts. Without that feedback loop, you're just running the same flawed calculations every week.
Making It Stick With Automation
The hardest part isn't building the framework — it's maintaining it week after week when everything else demands attention.
This is where AI-powered operational software earns its keep. Instead of manually pulling sales data, calculating velocities, and updating spreadsheets, modern platforms can automate the entire data flow. They pull sales history directly from your POS or order management system, calculate all three forecasting methods automatically, and flag items that need review based on your escalation rules.
AI automation can also surface patterns that are easy to miss in spreadsheets. Those scout troop orders mentioned above? A platform tracking customer order patterns would likely have caught the school calendar correlation within a few weeks rather than months. The same logic applies to competitor stockouts, social mention spikes, or weather-driven seasonal shifts.
The best implementations keep human judgment in the loop while automating the repetitive calculations. You make the calls on risk tolerance and inventory investment. The software handles the math, tracks the errors, and refines adjustment factors based on actual results. That combination — human judgment plus automated data processing — is where the real efficiency gains show up.
Beyond the Numbers
The framework only works if it fits your actual operation. Don't try to forecast 500 SKUs weekly if you're a one-person shop. Start with your top 20 items, get comfortable with the rhythm, then expand.
Don't chase forecast accuracy at the expense of operational simplicity either. A 70% accurate forecast you actually use beats a 90% accurate model that sits unused because it's too complex to maintain.
Inventory forecasting is ultimately about cash flow and customer satisfaction, not mathematical precision. Every stockout costs you sales and customer trust. Every overstock ties up cash you need elsewhere. The framework helps balance those trade-offs, but the judgment calls are still yours.
Some items shouldn't be forecasted at all. Ultra-slow movers, special orders, and highly seasonal products often work better with simple min/max rules. Save the forecasting effort for items where it actually moves the needle.
This framework isn't meant to be perfect. It's meant to be usable, maintainable, and accurate enough to meaningfully improve your inventory decisions. Start with the basics, track your errors, and refine based on what you learn about your specific demand patterns.
The businesses that get inventory management right aren't usually running the most sophisticated forecasting models. They're the ones with repeatable processes they actually follow, clear rules for unusual situations, and the discipline to learn from their mistakes over time.
Forecasting with limited data requires different tools than forecasting with clean, complete information. This framework is built for that reality. Your inventory problems won't disappear overnight, but with a systematic approach designed for small business realities, you can stop the constant fire-fighting and start making proactive decisions based on actual signals rather than hope.
Ready to optimize your inventory operations?
Join 2,000+ businesses using Listoly to reduce stockouts, save time, and improve order accuracy.