



Most small businesses track inventory metrics that look great on dashboards but never actually change how decisions get made. The pattern is frustratingly consistent: teams collect data on turnover rates, stockout percentages, and carrying costs, then keep making the same gut-based ordering decisions they always did.
The disconnect happens because metrics alone don't create action. You need a decision system that connects specific thresholds to pre-defined operational responses. Not vague guidelines about "improving turnover" — concrete triggers like "when fast-moving SKU coverage drops below 18 days, execute bulk reorder protocol regardless of MOQ penalties."
Why traditional KPI tracking breaks down in small operations
Small inventory teams face a challenge that enterprise systems completely ignore: the same two or three people handling purchasing also manage receiving, cycle counts, vendor relationships, and usually some customer service. When your purchasing manager is also your warehouse lead, complex KPI frameworks become expensive distractions.
Traditional inventory KPI systems assume you have a dedicated analyst who can interpret metric trends and recommend actions. Small businesses don't have that. By the time someone notices excess stock metrics creeping up for two months, you're already sitting on $40,000 in dead inventory that seemed like a smart buy during last quarter's supplier promotion.
The math compounds fast. A business doing around $2 million in revenue typically carries $280,000–$320,000 in inventory. Poor KPI response times mean that number drifts to $380,000 while sales stay flat. That extra $60,000–$80,000 in working capital, earning nothing and occupying warehouse space, represents missed opportunities everywhere else in the operation.
What works is building decision triggers directly into the metrics themselves. Not "monitor carrying costs" but "when carrying cost per SKU exceeds $3.20 for two consecutive weeks, execute SKU rationalization protocol starting with bottom 20% performers."
Building your 6-metric decision framework
After watching small operations struggle with 15+ metrics they never act on, the most effective approach centers on six core measurements that cover cash flow, operational efficiency, and customer satisfaction. Each metric needs three components: the calculation method, the decision threshold, and the specific action protocol.
Never run out of stock or overorder again.
Listoly streamlines inventory workflows to keep your business stocked and profitable.
- Real-time stock tracking
- Automated reorder alerts
- Supplier and purchase management
No credit card required
Document the calculation, threshold, and action protocol for each metric in one place so triggers can be executed without debate.
Metric 1: Cash-to-cash cycle time
This tells you how long your money stays trapped in inventory before returning as collected revenue.
Days Inventory Outstanding + Days Sales Outstanding - Days Payables Outstanding
-
Inventory sits for 45 days
-
Customer payment takes 30 days
-
You pay suppliers in 25 days
-
Cash cycle = 45 + 30 - 25 = 50 days
Decision threshold: When cash cycle exceeds 55 days
Action trigger: Renegotiate payment terms with your top 5 suppliers, targeting net-45. Simultaneously launch an early payment discount for customers — 2% for payment within 10 days.
This metric forces coordination between purchasing, sales, and finance in a way most small teams never think about. One retailer discovered their cash cycle had crept to 67 days because they'd accepted net-15 terms from a new supplier without adjusting customer payment incentives to compensate.
Metric 2: Coverage days by velocity segment
Instead of calculating one average coverage number, segment SKUs into three velocity groups:
-
Fast movers (top 20% of sales) Target 15-25 days coverage
-
Standard velocity (middle 60%) Target 30-45 days coverage
-
Slow movers (bottom 20%) Target 45-70 days coverage
Calculate as: (Current Stock / Average Daily Usage)
Decision threshold: When any segment moves outside its target range for 5 consecutive days
-
Fast movers below range
Execute emergency reorder with expedited shipping if margin allows
-
Standard above range
Freeze reorders and implement promotional pricing
-
Slow movers above range
Begin liquidation protocol (bundling, clearance, donation)
Metric 3: Perfect order rate
This compound metric captures whether you're actually delivering what customers expect:
(Orders delivered complete × On time × Damage free × Accurately invoiced) / Total Orders
A business shipping 1,000 orders where 950 arrive complete, 920 on time, 980 undamaged, and 990 correctly billed has a perfect order rate of:
(950/1000) × (920/1000) × (980/1000) × (990/1000) = 85.8%
Decision threshold: Below 88% for any rolling 7-day period
Action trigger: Root cause analysis focused on the lowest-scoring component. If completion rate is the issue, implement allocation holds on fast-moving SKUs. If damage spikes, audit packaging protocols and carrier performance.
Metric 4: Supplier performance index
Track this monthly for each vendor:
(On-time deliveries × Order accuracy × Quality acceptance) / Maximum possible score
For a supplier with 10 monthly orders where 8 arrive on time, 9 are accurate, and 9 pass quality:
(8/10) × (9/10) × (9/10) = 64.8% performance
Decision threshold: Any supplier below 70% for two consecutive months
Action trigger: Formal performance review with the supplier, implementation of penalty clauses where available, and activation of backup supplier relationships for critical SKUs.
Metric 5: Inventory accuracy rate
Physical count accuracy tells you whether your system data matches reality:
(Number of SKUs with accurate counts / Total SKUs counted) × 100
During a cycle count of 100 SKUs where 89 match system quantities within acceptable variance (usually ±2%):
89/100 = 89% accuracy
Decision threshold: Below 95% accuracy in any count
Action trigger: Immediate full count of high-value SKUs, investigation of receiving and picking procedures, and daily spot counts for problem categories until accuracy stabilizes.
Metric 6: Working capital productivity
This shows how efficiently your inventory investment generates gross profit:
Gross Profit / Average Inventory Value
A business generating $600,000 annual gross profit on $150,000 average inventory:
$600,000 / $150,000 = 4.0x productivity
Decision threshold: Drops below 3.5x for any quarter
Action trigger: SKU rationalization on items running below 2.0x productivity, renegotiation of payment terms with suppliers, and a pricing review on slow-moving inventory.
| Metric | Definition |
|---|---|
| Metric 1: Cash-to-cash cycle time | This tells you how long your money stays trapped in inventory before returning as collected revenue. |
| Metric 2: Coverage days by velocity segment | Instead of calculating one average coverage number, segment SKUs into three velocity groups. |
| Metric 3: Perfect order rate | This compound metric captures whether you're actually delivering what customers expect. |
| Metric 4: Supplier performance index | Track this monthly for each vendor using on-time, accuracy and quality measures. |
| Metric 5: Inventory accuracy rate | Physical count accuracy tells you whether your system data matches reality. |
| Metric 6: Working capital productivity | Shows how efficiently your inventory investment generates gross profit. |
Each metric needs three components: the calculation method, the decision threshold, and the specific action protocol.
Creating your decision dashboard layout
The most functional dashboards for small teams avoid information overload while keeping critical triggers visible. Here's a layout that actually drives decisions:
-
Top row - Daily triggers (check at 9 AM) - Fast mover coverage days (with red/yellow/green indicators) - Perfect order rate (7-day rolling) - Critical SKU stockout alerts
-
Middle row - Weekly review triggers (Monday morning) - Cash cycle trend (with 55-day threshold line) - Inventory accuracy from latest counts - Working capital productivity
-
Bottom row - Monthly strategic triggers - Supplier performance matrix - Velocity segment migration report - Excess inventory aging analysis
Each metric displays three elements: current value, threshold line, and required action when crossed. When fast mover coverage shows red, the reorder protocol runs. No interpretation required.
Sample action rules for different team sizes
Solo operator or 2-person team
Decision rules need to be binary and immediate. No committee meetings, no analysis paralysis.
Coverage below threshold: Place reorder immediately using your quick-order template with your preferred supplier. No shopping around, no negotiation — speed matters more than saving 3%.
Perfect order rate drops: Stop taking new orders for 2 hours. Audit the last 20 orders for patterns. Fix the most common issue first.
Inventory accuracy fails: Lock receiving for half a day. Count your top 50 SKUs. Document variances. Resume with a new checking protocol in place.
3-5 person team
With a bit more bandwidth, graduated responses become practical:
Tier 1 response (yellow zone): Designated person investigates within 24 hours
Tier 2 response (red zone): All hands meeting within 2 hours
Tier 3 response (critical): Operations pause until resolved
When working capital productivity drops to 3.7x (yellow), your inventory lead has one day to identify bottom performers. At 3.5x (red), the full team meets to decide on liquidation strategies. Below 3.3x (critical), freeze all non-essential purchasing.
6-10 person team
Larger teams can run parallel response protocols without everything grinding to a halt:
Primary responder: Takes immediate containment action
Secondary analyst: Investigates root cause
Process owner: Implements the permanent fix
When coverage days spike above threshold, the buyer cancels pending orders, the analyst reviews why forecasting missed it, and the ops manager adjusts the forecasting model. Three tracks running simultaneously instead of one person doing all three in sequence.
Calculation examples for common scenarios
A few real-world calculations for a small electronics retailer doing around $3 million annually:
Scenario 1: Seasonal surge detection
-
Current stock
340 units
-
Last 30-day average
8 units/day
-
Coverage
340/8 = 42.5 days
But daily sales are trending up:
-
Last 7 days
14 units/day
-
Recalculated coverage
340/14 = 24.3 days
Since this is a fast mover approaching the 25-day threshold, you trigger an immediate reorder. That calculation probably prevented a November stockout worth roughly $8,000 in missed sales.
Scenario 2: Hidden cash trap identification
-
Inventory value
$420,000
-
Monthly COGS
$180,000
-
Days inventory
(420,000/180,000) × 30 = 70 days
-
Collection period
35 days
-
Payment terms
30 days
-
Cash cycle
70 + 35 - 30 = 75 days
This triggers supplier negotiation protocol. Moving just your top 3 suppliers from net-30 to net-45 drops the cash cycle to around 60 days, freeing up approximately $37,000 in working capital.
Scenario 3: Multi-location allocation trigger
-
Location A shows
Bluetooth speakers in stock: 12 units; Daily velocity: 3 units; Coverage: 4 days
-
Location B shows
Stock: 45 units; Daily velocity: 2 units; Coverage: 22.5 days
The system triggers an automatic transfer of 15 units from B to A, balancing coverage at roughly 11 days each and preventing the Location A stockout.
When manual KPI tracking becomes impossible
The breaking point for manual tracking typically hits somewhere around $2 million in revenue or 500 active SKUs. At that scale, daily calculations across six metrics become a part-time job that nobody on a small team actually has time for.
Consider what manual tracking requires:
-
Daily coverage calculations across velocity segments (minimum 30 minutes)
-
Perfect order rate compilation from multiple sources (45 minutes)
-
Weekly supplier performance reviews (2 hours)
-
Inventory accuracy spot checks and documentation (1 hour daily)
That's close to 20 hours a week just on measurement — not including any actual response actions. This is where AI-powered operational software shifts from nice-to-have to genuinely necessary. Modern platforms calculate these metrics in real-time, trigger alerts when thresholds cross, and suggest specific response actions based on what's worked before.
The real value isn't automation of the calculations. It's the instant detection. When fast-mover coverage drops at 2 PM on a Tuesday, you need to know then, not during Friday's weekly review when it's already too late.
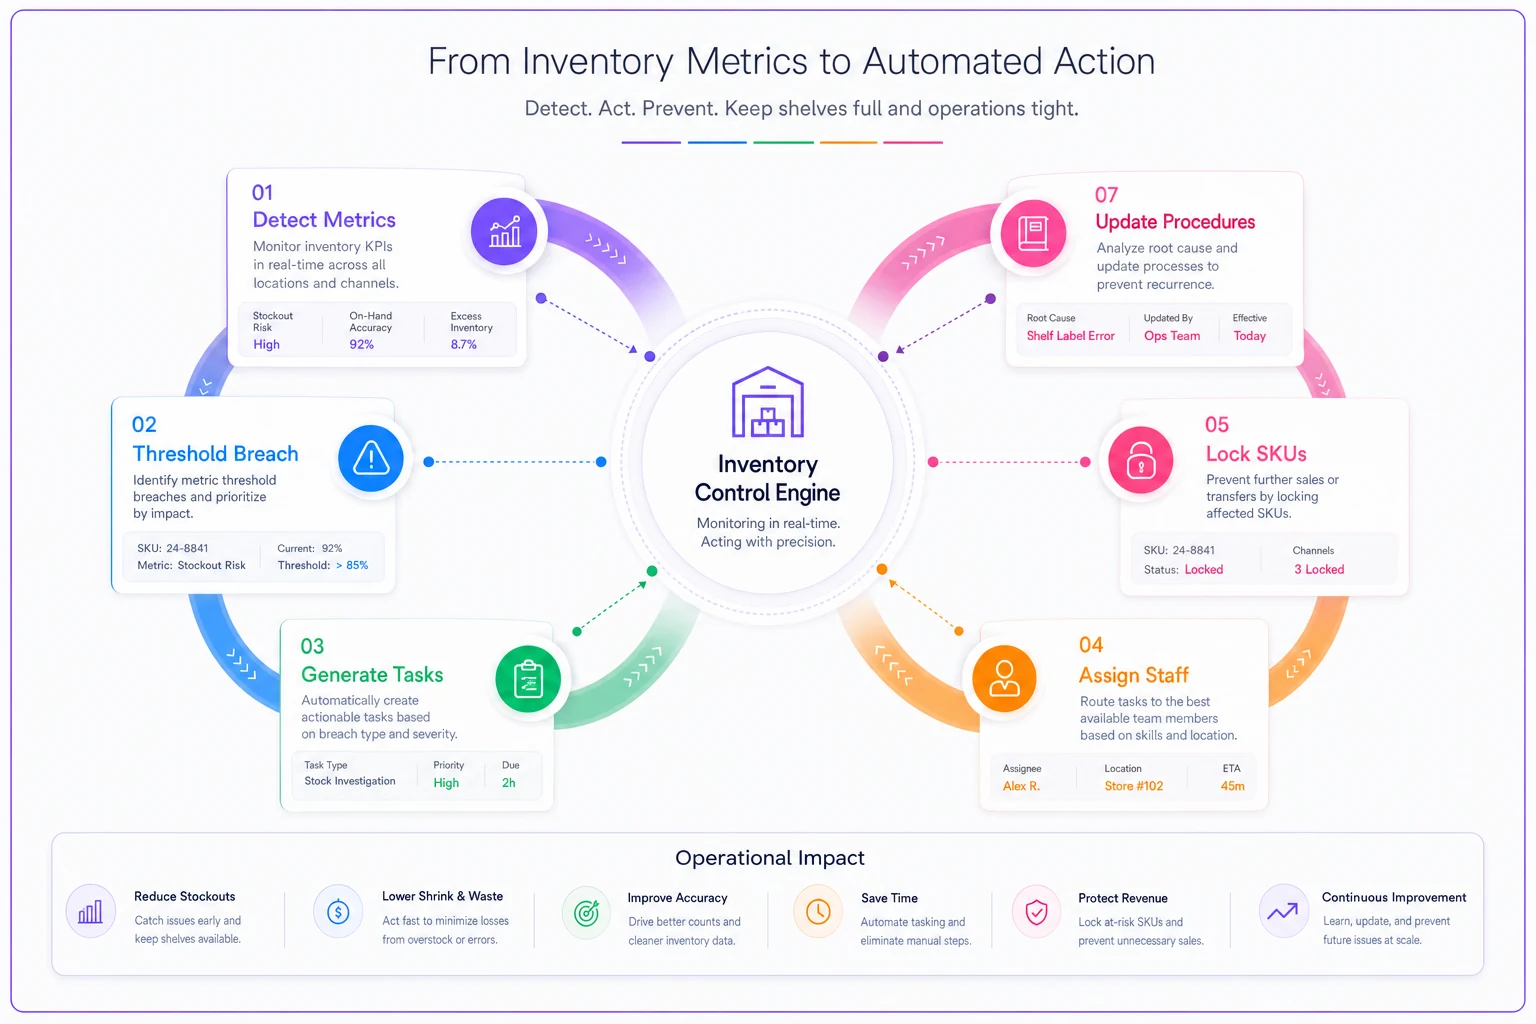
Converting metrics into automated workflows
The most effective inventory KPI system connects measurements directly to action workflows. Instead of dashboards that need interpretation, you want triggers that initiate specific responses.
-
Generate count sheets for problem categories
-
Schedule count assignments to available staff
-
Lock affected SKUs from sales until verified
-
Document variances with photo evidence
-
Update procedures based on error patterns
That removes the delay between detection and response that quietly kills small business efficiency. AI automation handles the routine decision logic while your team focuses on exceptions and anything genuinely strategic.
Here’s a short workflow visualization to make the automation steps clear.
The same principle applies to supplier performance. When a vendor drops below threshold, the system pulls delivery history, calculates impact costs, drafts an initial discussion agenda, and flags alternative suppliers based on SKU requirements and historical pricing.
Common implementation mistakes to avoid
Trying to track everything immediately
Start with two or three metrics. Master the response protocols before adding complexity. One client tried implementing all six metrics at once and ended up ignoring all of them within a month.
Setting aspirational instead of realistic thresholds
Triggers should reflect operational reality, not wishful thinking. If your current cash cycle runs 65 days, don't set the threshold at 30. Start at 70 and tighten gradually as processes improve.
Ignoring the cost of response actions
Each trigger creates work. Make sure the benefit exceeds the effort. Triggering daily supplier reviews for 2% variations wastes time better spent on customer service or sales.
Failing to document why thresholds exist
Six months later, nobody remembers why fast-mover coverage got set at 18 days instead of 20. Document the logic, the tradeoffs, and what happened when you tested different levels. Future-you will appreciate it.
Building your implementation timeline
A practical rollout for an inventory KPI system takes about 8 weeks:
-
Weeks 1-2 Calculate baseline metrics manually. Understand your current state without trying to fix anything yet. Document calculation methods and data sources.
-
Weeks 3-4 Set initial thresholds based on baseline plus a 10-15% buffer. Create simple response protocols — one page maximum per trigger.
-
Weeks 5-6 Run parallel testing. Track metrics and simulate responses without actually implementing them. Identify which triggers fire too often or never fire.
-
Weeks 7-8 Go live with adjusted thresholds. Start with daily metrics only. Add weekly and monthly metrics once the daily rhythm feels routine.
After launch, expect about 30 days of adjustment as the team learns the new decision rhythm. Some thresholds will prove too tight, others too loose. That's normal. The goal isn't a perfect system on day one — it's consistent improvement over gut-based decisions.
Small operations that build this kind of structured KPI system typically see measurable results within 90 days: cash cycles dropping by 8-12 days, perfect order rates improving by 10-15%, and excess inventory shrinking by 20-30%. More importantly, the whole team starts speaking the same operational language and making consistent calls even when the owner isn't around to weigh in.
Metrics without triggers are just expensive decorations. Every KPI in your system needs to connect to a specific action that someone can execute today, not someday when you have more resources. That's what separates reactive firefighting from an operation that actually runs well.
Ready to optimize your inventory operations?
Join 2,000+ businesses using Listoly to reduce stockouts, save time, and improve order accuracy.