


Every inventory manager knows that sinking feeling. The POS shows 47 units of your bestselling SKU. The warehouse management system says 62. Physical count finds 54. Meanwhile, three customers just placed orders, and nobody knows if you actually have the stock to fulfill them.
Inventory counts are bleeding money through a thousand tiny cuts
This disconnect between POS and warehouse inventory creates operational chaos that compounds daily. Orders get oversold. Stock sits dead because the system thinks it's already gone. Replenishment orders arrive too early or too late. Customer service spends hours apologizing for phantom inventory.
Most businesses try fixing this with brute-force cycle counts and manual adjustments. This just masks the underlying timing and workflow problems. You end up in an endless loop of reconciliation without ever addressing why the numbers drift apart in the first place.
Start with sync timing mismatches (the silent killer)
Sync timing causes more inventory discrepancies than any other factor. Your POS processes a sale at 2:47 PM. The transaction syncs to your inventory system at 3:00 PM. But the warehouse team picked and shipped that order at 2:52 PM, recording it immediately in their WMS. For thirteen minutes, your systems disagree about reality.
Never run out of stock or overorder again.
Listoly streamlines inventory workflows to keep your business stocked and profitable.
- Real-time stock tracking
- Automated reorder alerts
- Supplier and purchase management
No credit card required
Multiply this by hundreds of transactions across multiple sales channels. Add batch processing delays, API rate limits, and network latency. A retail operation processing 300 transactions daily with 15-minute sync delays creates roughly 75 hours of cumulative timing mismatches every single day.
Pull transaction logs from both systems for the same 24-hour period. Sort by timestamp and look for patterns. Discrepancies usually cluster around specific times - top of the hour for batch syncs, or during high-traffic periods when APIs throttle.
Quick SQL check to identify sync delays: SELECT pos.transactionid, pos.timestamp as postime, wms.timestamp as wmstime, TIMESTAMPDIFF(MINUTE, pos.timestamp, wms.timestamp) as syncdelay FROM postransactions pos LEFT JOIN wmstransactions wms ON pos.transactionid = wms.transactionid WHERE DATE(pos.timestamp) = CURDATE() - INTERVAL 1 DAY ORDER BY sync_delay DESC;
Most businesses discover their "real-time" integration actually runs anywhere from 5 to 45 minutes behind. API-based syncs need webhook implementations instead of polling. Batch file transfers should switch to event-driven triggers. Sometimes just adjusting the sync frequency from hourly to every 5 minutes eliminates 90% of timing conflicts.
Prioritize webhook-based integrations for high-velocity SKUs to eliminate polling delays and reduce sync conflicts.
The fix depends on your integration method. Identifying the delay pattern comes first.
Returns processing breaks every assumption
Returns create inventory chaos because they violate the standard flow assumptions that most systems make. A customer buys an item on Monday, decreasing inventory by one. They return it Thursday, theoretically adding one back. Simple, right?
Not at all. The return might process through the POS immediately but not reach the warehouse for physical inspection until Friday. The warehouse marks it received but holds it in quarantine pending quality check. Customer service might issue a refund before the physical item even ships back. Each system updates inventory based on its own logic and timeline.
A clothing retailer discovered that returns caused 40% of their inventory mismatches. Their POS added returned items back to available inventory instantly upon refund approval. The warehouse team held returns for 48-hour inspection before restocking. During peak return periods after holidays, hundreds of items existed simultaneously in inventory limbo.
Returns require tracking three separate states:
-
Return initiated (customer side)
-
Return received (warehouse side)
-
Return processed (inventory available)
Workflow that actually works:
-
Configure POS to mark returns as "pending restock" instead of immediately available
-
Create a dedicated returns receiving area in your warehouse with its own location code
-
Use a two-step process
receive to quarantine, then inspect and restock
-
Only update available inventory after physical inspection confirms sellable condition
-
Track return aging - anything over 72 hours in quarantine needs escalation
For businesses processing 20-50 returns weekly, this structured approach typically reduces return-related mismatches by about 75%. The key is forcing all systems to acknowledge that returned inventory isn't instantly sellable.
Reserved stock and allocation rules create phantom inventory
Reserved stock seems straightforward until you realize every system defines "reserved" differently. Your POS might reserve inventory the moment a customer adds items to cart. Your warehouse system only reserves upon payment confirmation. Meanwhile, your B2B portal reserves inventory for 24 hours on quote generation.
Three customers looking at the same product through different channels might all see it as available, while your warehouse shows it fully allocated.
A wholesale distributor processing both B2B and retail orders kept overselling their high-margin items. Investigation revealed their B2B system reserved inventory for quotes that converted at 30% rate. The other 70% of reserved stock sat phantom-allocated for days, invisible to retail customers who wanted to buy immediately. They were literally turning away ready buyers to protect inventory for maybes.
| Reservation Type | Typical Duration | Actual Conversion Rate | Hidden Cost |
|---|---|---|---|
| Shopping cart | 15-60 minutes | 3-8% | Lost impulse sales |
| B2B quotes | 24-72 hours | 25-40% | Tied up working capital |
| Pending payment | 2-4 hours | 60-80% | Customer service issues |
| Ship-to-store | 3-5 days | 95%+ | Inventory opacity |
Reconciliation requires mapping every reservation rule across all systems. First, identify all reservation triggers. Cart additions, quote generation, payment pending, transfer initiated, customer will-call, pre-orders, backorder allocation. Each creates a different reservation type with different expiration rules.
Next, establish a hierarchy. Which reservation types take priority? If a B2B quote and retail order compete for the last unit, who wins? Without clear rules, your staff makes different decisions each time.
Implement automatic reservation cleanup. Reserved but unpaid inventory should release after 2 hours. Quoted inventory releases after 48 hours without follow-up. Cart abandonments clear after 30 minutes. These seem aggressive, but phantom reservations kill more sales than actual stockouts.
Reconciliation requires mapping every reservation rule across all systems. First, identify all reservation triggers. Cart additions, quote generation, payment pending, transfer initiated, customer will-call, pre-orders, backorder allocation. Each creates a different reservation type with different expiration rules.
Cutoff rules and timezone confusion
Cutoff rules determine which day's inventory movements belong to which reconciliation period. Your POS closes the day at midnight local time. Your warehouse runs on UTC. Your e-commerce platform uses customer timezone. A single order placed at 11:47 PM might appear in three different daily reports.
An East Coast retailer with West Coast fulfillment discovered their "daily" reconciliation compared 27 hours of POS data against 21 hours of warehouse data. The warehouse cutoff at 9 PM Eastern meant every evening's sales leaked into the next day's warehouse report. They ran permanent 15-20% discrepancies just from timezone math.
The diagnostic process:
-
Document every system's cutoff time and timezone
-
Map when each system's "day" actually begins and ends
-
Identify overlap and gap periods
-
Adjust your reconciliation window to match reality, not assumptions
Most businesses need a rolling reconciliation window instead of fixed daily cuts. Compare POS transactions from 12:01 AM to 11:59 PM against warehouse movements from 12:01 AM to 2:59 AM the next day (accounting for processing delay). This captures the full cycle while avoiding double-counting.
Compare POS transactions from 12:01 AM to 11:59 PM against warehouse movements from 12:01 AM to 2:59 AM the next day (accounting for processing delay). This captures the full cycle while avoiding double-counting.
SQL queries and exports that actually find problems
Generic inventory reports hide the specific patterns that reveal systematic issues. You need targeted queries that surface particular types of mismatches.
SELECT sku, DATE(transactiondate) as date, SUM(posqty) as posmovement, SUM(wmsqty) as wmsmovement, SUM(posqty - wmsqty) as dailydrift, SUM(SUM(posqty - wmsqty)) OVER (PARTITION BY sku ORDER BY DATE(transactiondate)) as cumulativedrift FROM inventorytransactions WHERE transactiondate >= DATESUB(NOW(), INTERVAL 30 DAY) GROUP BY sku, DATE(transactiondate) HAVING ABS(cumulativedrift) > 5 ORDER BY ABS(cumulativedrift) DESC;
This identifies SKUs where small daily discrepancies compound into major problems. Usually points to systematic issues like consistent rounding errors or missing transaction types.
SELECT sku, AVG(dailyposunits) as avgposvelocity, AVG(dailywmsunits) as avgwmsvelocity, (AVG(dailyposunits) - AVG(dailywmsunits)) / AVG(dailyposunits) * 100 as velocitymismatchpercent FROM dailyinventorysummary WHERE date >= DATESUB(NOW(), INTERVAL 14 DAY) GROUP BY sku HAVING ABS(velocitymismatchpercent) > 10 ORDER BY ABS(velocitymismatch_percent) DESC;
When POS and warehouse show different velocity patterns for the same SKU, you're usually missing an entire transaction category. Common culprits: warranty replacements, damage writeoffs, or sample distributions that only one system tracks.
Short-term fixes while building long-term solutions
You can't pause operations for a complete systems overhaul. Here's a practical triage approach:
Week 1-2: Stabilize critical SKUs Focus on your top 20% of SKUs by revenue. Run hourly syncs for these items only. This creates technical debt, but losing sales on bestsellers costs more than imperfect architecture. Create a dedicated reconciliation view that operations checks twice daily.
Week 3-4: Implement exception reporting Stop trying to reconcile everything. Flag only meaningful discrepancies. Variances over 5 units or 10% (whichever is smaller). Items showing zero in one system but positive in another. Negative inventory anywhere. Reserved quantities exceeding on-hand.
Week 5-6: Create temporary buffer rules Add safety stock calculations that account for typical variance. If SKU-123 typically shows a 3-unit discrepancy between systems, build that into your available-to-promise logic. This feels like admitting defeat, but customers care about getting their orders, not your data perfection.
Week 7-8: Document patterns for permanent fixes Track every manual adjustment with a reason code. After a month, you'll see clear patterns. Typically 40% from returns processing delays, 25% from cutoff timing, 20% from B2B reservation rules, 15% from damaged goods handling.
This data justifies the development time for permanent solutions.
Building a sustainable reconciliation workflow
The standard advice says "reconcile everything daily." In practice, this becomes a full-time job that still misses systematic issues. Build a tiered approach instead:
Continuous monitoring (automated) Negative inventory alerts. Velocity mismatches over 20%. Any SKU showing zero in only one system.
Daily spot-checks (15 minutes) Top 10 revenue SKUs. Any item with pending receipts. Previous day's problem items.
Weekly deep-dive (2 hours) Full variance report. Pattern analysis on adjustments. Sync timing verification.
Monthly systematic review (half day) Transaction type mapping. Cutoff rule validation. Reserved inventory aging. Returns processing metrics.
Here's a simple visual of that workflow.
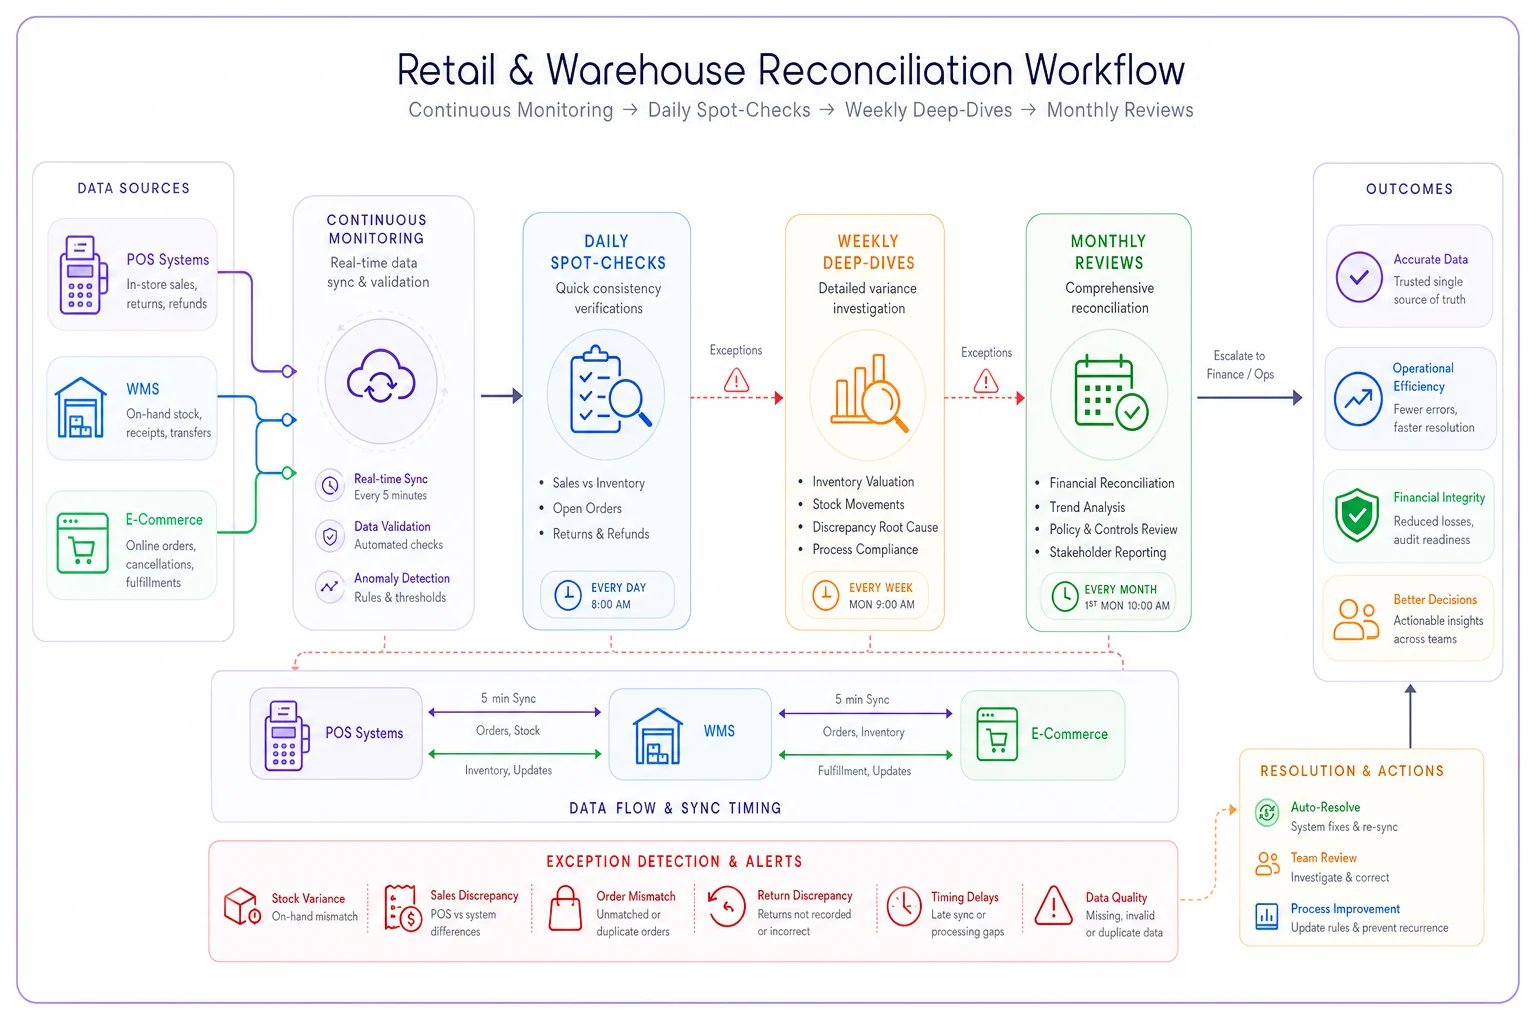
This graduated approach catches critical issues immediately while still maintaining systematic oversight. It's sustainable for a small team to maintain.
The businesses that maintain accurate inventory aren't the ones with perfect systems. They have clear troubleshooting processes and the discipline to follow them consistently. Start with sync timing, work through the systematic issues, and build sustainable workflows that catch problems before they compound.
When to stop patching and start rebuilding
Sometimes the reconciliation problems reveal fundamental architecture issues that Band-Aids won't fix. If you're spending more than 10 hours weekly on inventory reconciliation, or if discrepancies consistently exceed 5% of inventory value, patching isn't enough.
Modern AI-powered operational platforms handle this through unified inventory pools with real-time event streaming. Instead of syncing between systems, all channels read from and write to a single source of truth. The POS, warehouse, and e-commerce platform become interfaces to the same underlying inventory data.
AI automation helps by identifying patterns in discrepancies, predicting common timing mismatches, and automating routine reconciliation tasks that currently require manual intervention. But even with better architecture, you need the diagnostic and troubleshooting skills to identify when and why numbers drift.
Your inventory accuracy improves not through massive overhauls but through methodical identification and resolution of specific, recurring issues.
Your inventory accuracy improves not through massive overhauls but through methodical identification and resolution of specific, recurring issues.
Ready to optimize your inventory operations?
Join 2,000+ businesses using Listoly to reduce stockouts, save time, and improve order accuracy.