


Launching new products feels like placing a massive bet while blindfolded. You're committing cash to inventory before getting a single data point about actual demand. Too conservative? You stock out during peak interest and competitors grab your customers. Too aggressive? You're sitting on dead inventory that eats working capital for months.
The traditional forecasting playbook breaks down completely here. No historical sales patterns. No seasonality curves. No customer purchase frequency. Just educated guesses that often miss by 60-80% in either direction.
After watching hundreds of product launches across retail, ecommerce, and wholesale operations, there's a clear pattern: businesses that succeed at new SKU forecasting don't try to predict perfectly. They build systems that adapt quickly and limit exposure while gathering real demand signals.
The analog-SKU method beats pure guesswork
Most inventory managers default to two extremes when forecasting new SKUs with no sales history. They either make wild guesses based on gut feel or they overthink it with complex market research that rarely translates to actual buying behavior.
The analog-SKU approach cuts through both problems. You identify 3-5 existing products that share key characteristics with your new launch, then use their early sales patterns as a baseline forecast template.
A specialty tea company launching a new chamomile blend would look at their existing herbal teas—not their entire catalog. They'd pull first-90-day sales data for their lavender tea, peppermint tea, and lemon balm blend. If those averaged 140 units in month one, 185 in month two, and 220 in month three, that becomes the baseline trajectory.
But raw copying rarely works. You need adjustment factors based on real differences:
Price point variance: A $24 premium blend won't move like a $12 basic tea. Look at velocity differences between your existing price tiers—if premium SKUs sell at 65% the rate of standard items, apply that factor.
Marketing support level: That lavender tea might have launched with an email campaign to 15,000 subscribers. Your new chamomile gets featured in a 500-person test segment. Scale expectations accordingly.
Seasonal timing: Launching hot chocolate in July versus November creates wildly different demand curves, even if the product is identical.
Channel differences: A SKU going exclusively to your website behaves differently than one hitting wholesale accounts on day one.
The math stays simple. Take your analog baseline, multiply by adjustment factors, and you have a starting forecast grounded in actual buying patterns rather than fantasy projections.
Pilot batch sizing determines your real risk exposure
The biggest mistake in new SKU launches happens at the purchase order stage. Businesses chase minimum order quantities from suppliers that force them into 6-12 months of inventory on an untested product.
Never run out of stock or overorder again.
Listoly streamlines inventory workflows to keep your business stocked and profitable.
- Real-time stock tracking
- Automated reorder alerts
- Supplier and purchase management
No credit card required
Smart operators structure pilot batches that let them test and adjust without catastrophic exposure. The key metric: your pilot should cover 45-60 days of optimistic forecast, not your supplier's convenient MOQ.
A boutique clothing brand launching a new jacket design might face a 500-unit MOQ from their manufacturer. Their analog forecast suggests 40 units monthly. Instead of accepting 12+ months of inventory risk, they negotiate alternatives:
-
Pay a 15% premium for a 200-unit pilot run
-
Split the order across 3 colorways to hit MOQ while spreading risk
-
Partner with another brand to share the production run
-
Find a local manufacturer for the pilot, even at 2x unit cost
The math almost always favors smaller pilots. Taking a $3 per unit hit on a 200-piece pilot costs $600. Getting stuck with 300 dead units for a year costs $4,500 in carrying costs plus the locked capital.
The math almost always favors smaller pilots.
Your pilot batch should answer three questions:
-
Does anyone actually want this product?
-
What's the real velocity range?
-
Which variants/options matter?
Anything beyond that scope is speculation disguised as planning.
Short reforecast cycles prevent inventory disasters
Traditional forecasting cycles run quarterly or even annually. For new SKUs with no history, that's like steering a ship by looking at last month's weather report.
Products launching without sales history need weekly reforecast cycles for the first 8-12 weeks. Not monthly. Not bi-weekly. Weekly.
Here's what actually gets tracked:
| Period | Tracked metrics |
|---|---|
| Week 1-2 | Daily unit movement, traffic/conversion rates, return signals |
| Week 3-4 | Velocity trends, customer segment patterns, channel performance gaps |
| Week 5-8 | Reorder indicators, variant preferences, competitive response |
| Week 9-12 | Seasonality signals, repeat purchase behavior, promotion responsiveness |
A natural foods distributor launching a new protein bar line discovered their mint chocolate variant sold 3x faster than projected while strawberry barely moved. By week three, they'd already adjusted their second production run. Companies on monthly cycles would have missed this entirely and either stocked out of mint or sat on strawberry inventory for months.
The reforecast formula is straightforward:
-
Take actual sales from available data
-
Project forward using analog SKU week-over-week patterns
-
Adjust for marketing events, seasonality, and competitive actions
-
Compare to original forecast and document variance reasons
This isn't about perfect prediction. It's about catching massive misses before they become expensive problems.
Here's a visualization of the weekly reforecast workflow.
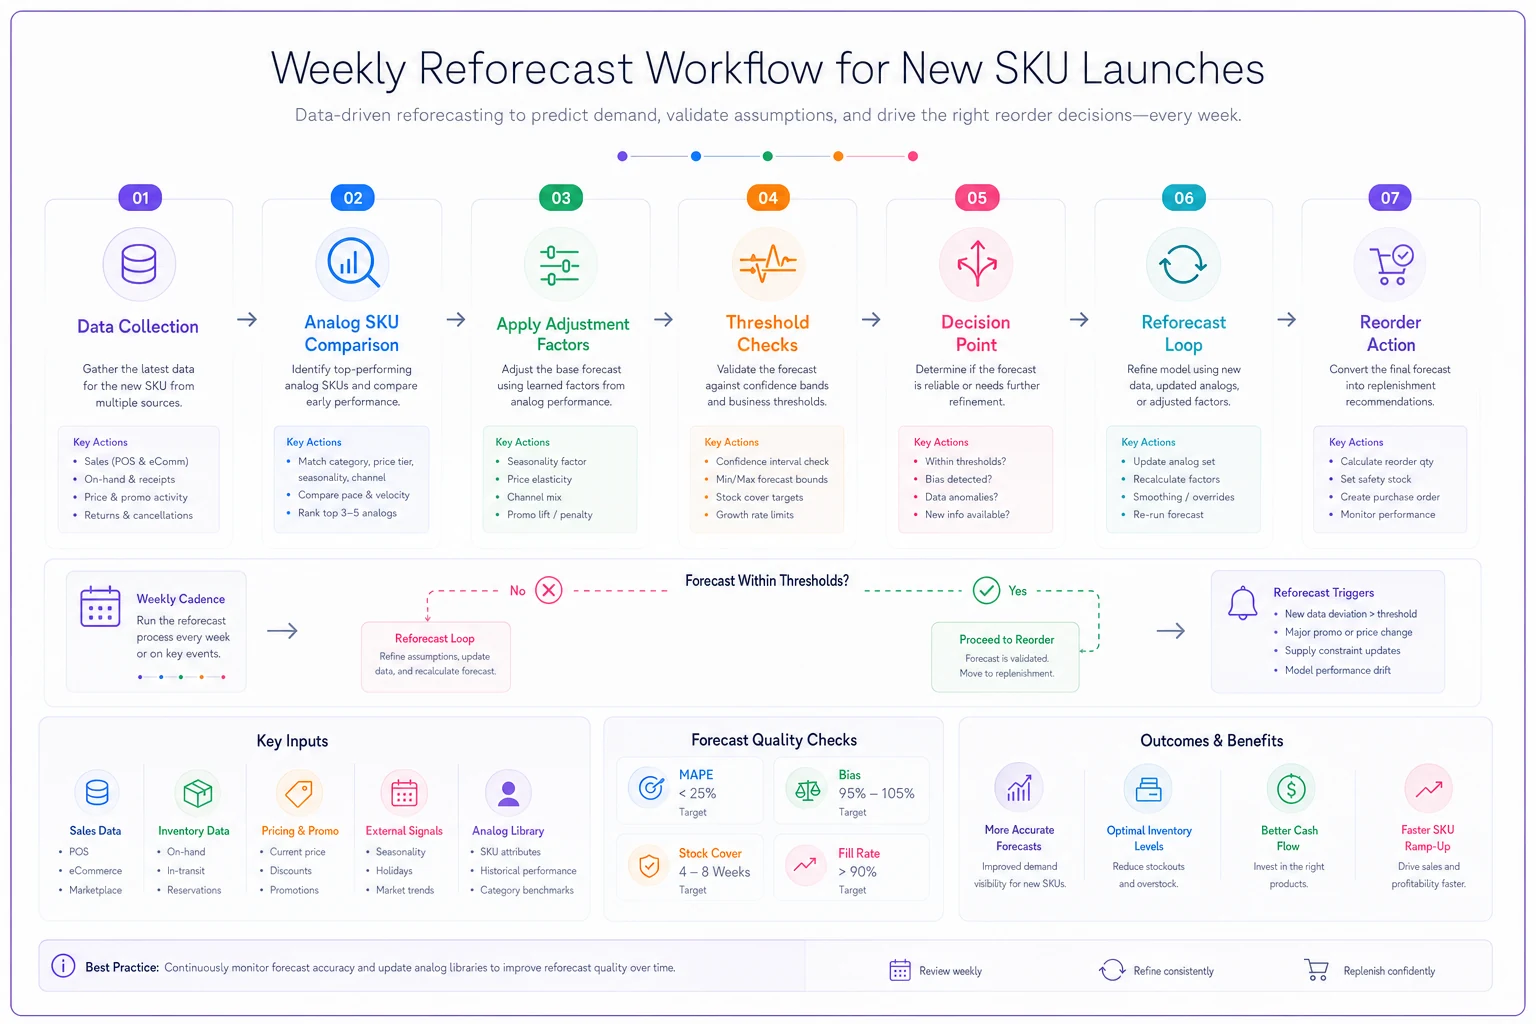
Use the diagram to guide your weekly checks and decision points during the first 8-12 weeks.
Decision thresholds that trigger action, not analysis paralysis
Data without decision rules just creates confusion. New SKU launches need clear thresholds that automatically trigger specific actions—no meetings, no debates, no delays.
Set these thresholds before launch, not during:
Stock-out prevention threshold: When inventory covers less than [leadtime + 2 weeks], reorder triggers regardless of velocity uncertainty. A skincare brand with 6-week manufacturing lead times triggers at 8 weeks of coverage.
Velocity confirmation threshold: After selling [20% of pilot batch], velocity estimates shift from analog-based to actual-based. If you piloted 200 units and sold 40, you now have real data.
Kill decision threshold: If sales hit less than [30% of forecast] after [50% of planned timeframe], begin exit planning. A forecast of 100 units monthly that only moves 25 units after two weeks signals trouble.
Scale-up threshold: When hitting [80% of optimistic forecast] for [3 consecutive periods], approve expanded production. Consistent overperformance justifies inventory investment.
Variant adjustment threshold: Any SKU variant selling at less than [40% of average variant rate] gets flagged for discontinuation or remarketing.
The specific numbers matter less than having numbers at all. Most businesses wait for "enough data" that never arrives. Clear thresholds force decisions while outcomes still matter.
Sample pilot experiments that generate real demand signals
The fastest path to accurate forecasting runs through structured experiments that reveal actual buying behavior. These aren't focus groups or surveys—they're real selling situations with measurable outcomes.
Geographic concentration test: Instead of spreading 500 units across 20 locations, concentrate 300 units in your 5 best locations and 200 in a controlled online test. This amplifies signal clarity. A specialty food brand tested a new sauce this way and discovered 80% of demand came from just 3 cities, completely reshaping their rollout strategy.
Price elasticity probe: Launch the same SKU at 3 price points across different channels or time periods. A jewelry designer tested earrings at $45, $58, and $72. The $58 price point generated 2.5x the revenue of either extreme—information worth far more than the margin difference.
Bundle attachment test: Offer the new SKU both standalone and bundled with proven products. This reveals whether it drives incremental sales or just shifts existing demand. A coffee roaster found their new single-origin beans sold 60% better in sampler packs than standalone, fundamentally changing their packaging strategy.
Promotional response test: Run an aggressive promotion early (week 2-3) to test price sensitivity and demand ceiling. If a 25% discount only moves 30% more units, you know the product has natural velocity limits.
Channel isolation test: Launch exclusively in one channel for 2-4 weeks before expanding. This creates clean data without channel interference. An outdoor gear brand learned their new tent sold 5x better through their catalog than their website—worth knowing before committing to inventory placement.
Each experiment should test one variable with a clear learning objective. Running multiple experiments simultaneously muddles the signals and defeats the purpose.
When forecasting without history makes sense (and when it doesn't)
Not every new SKU deserves elaborate forecasting frameworks. Sometimes the juice isn't worth the squeeze.
This approach works when:
-
Unit economics support at least 40% gross margins
-
Minimum viable batches are under $10,000
-
Lead times exceed 4 weeks
-
The category has proven demand
-
You have analog products with 6+ months of data
Skip this framework when:
-
You're testing made-to-order or print-on-demand products
-
Suppliers offer real-time reorder with 1-week leads
-
The total investment is under $1,000
-
You're private-labeling proven products
-
Customer pre-orders already exceed conservative forecasts
A custom furniture maker shouldn't build elaborate forecasts for made-to-order pieces. But a beauty brand committing $50,000 to a new serum absolutely needs this discipline.
Building forecasting systems that learn and adapt
Your first guess will be wrong. That's not pessimism—it's just how new SKU launches work. The businesses that do well here don't guess better, they adjust faster.
Inventory platforms with built-in AI automation can speed up this learning cycle considerably. Instead of manually tracking analog performance, calculating adjustment factors, and watching thresholds, automated systems handle these patterns continuously. They flag unusual behavior in pilot batches, adjust reorder points based on early sales signals, and help avoid the two most common traps: over-ordering untested products and missing reorder windows on surprise hits.
The underlying framework stays the same whether you're running it manually in a spreadsheet or through an operational platform. Find meaningful analogs. Size pilots conservatively. Reforecast frequently. Set clear decision triggers. Run targeted experiments.
What changes with proper automation is execution consistency. Weekly reforecasts actually happen weekly. Threshold breaches surface immediately. And pattern recognition across multiple SKU launches gradually improves your analog selection over time. The difference between catching a slow-mover in week 3 versus week 8 can mean thousands in carrying costs—that gap tends to close when the system is doing the monitoring instead of relying on someone to remember to check.
New product launches will always carry risk. But flying blind is a choice, not a requirement. The businesses that consistently nail new SKU launches don't have crystal balls—they have better systems for gathering signals, adapting quickly, and limiting downside exposure while they figure out what actually sells.
Ready to optimize your inventory operations?
Join 2,000+ businesses using Listoly to reduce stockouts, save time, and improve order accuracy.