

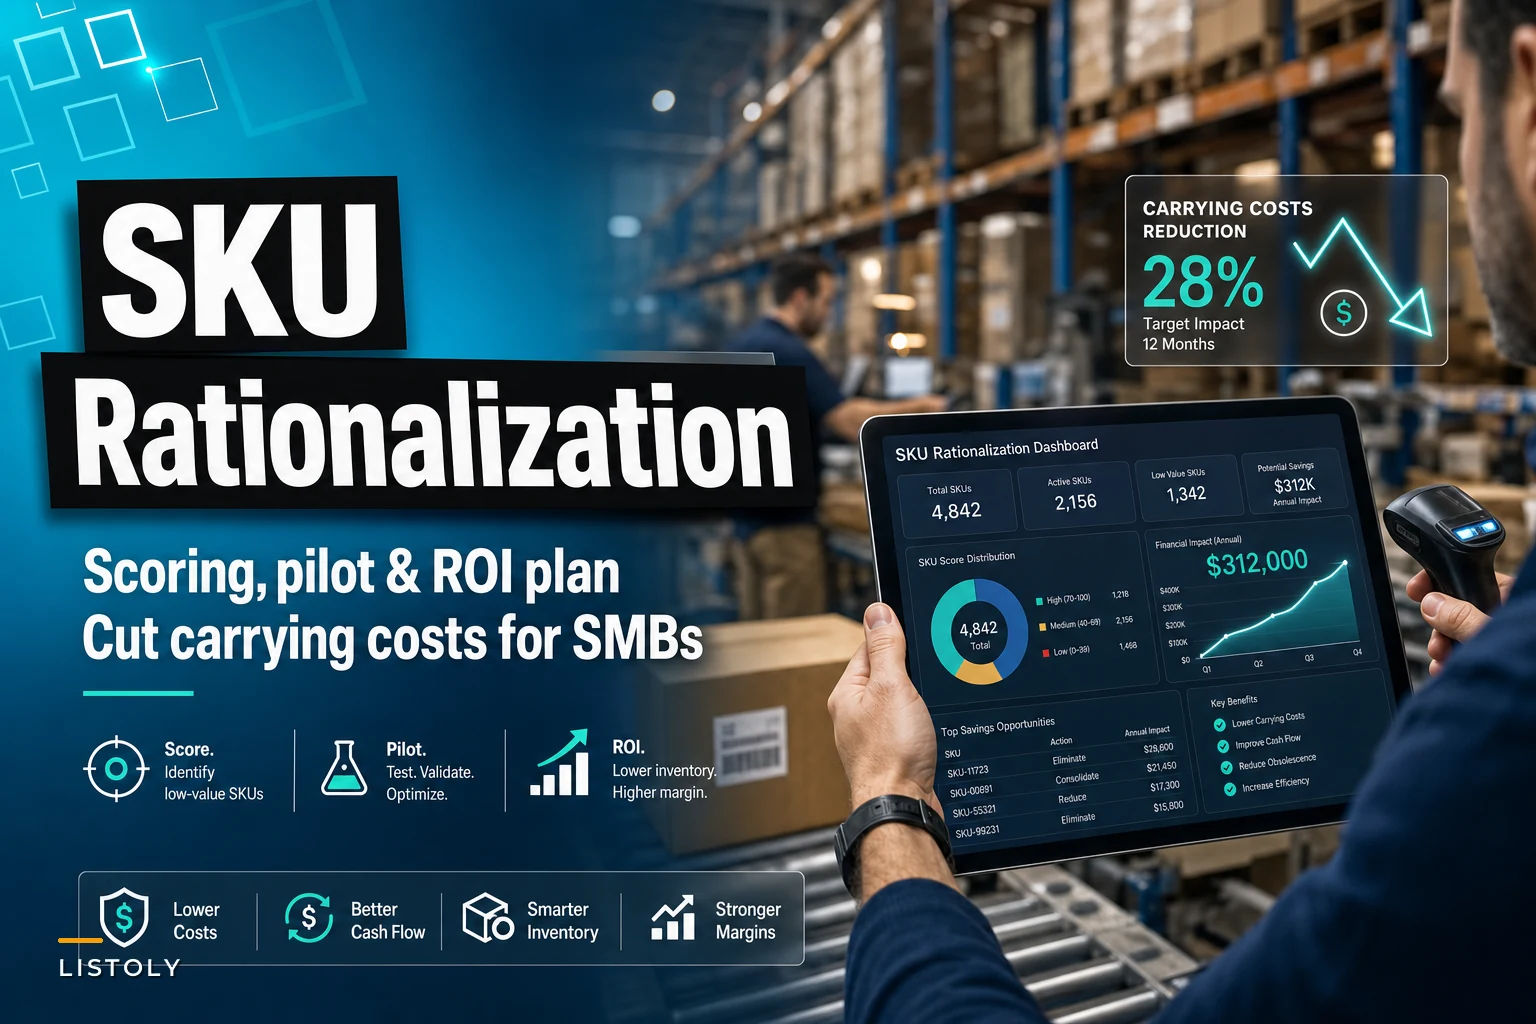

Most SKU rationalization guides tell you to "analyze your inventory turnover" and "identify slow movers." Useful in theory, but when you're managing 2,000+ SKUs with a small team, that advice doesn't get you very far.
The real challenge isn't identifying dead inventory—it's knowing which products to cut without accidentally killing sales or disappointing customers who actually matter. The difference between a clean rationalization and a costly mistake almost always comes down to having the right scoring system and a disciplined pilot approach.
Building a weighted scoring algorithm that captures actual profitability
Traditional ABC analysis misses too much. A product might move slowly but carry solid margins and low holding costs. Another might sell frequently but generate enough returns to wipe out any profit. Your scoring system needs to reflect how your operation actually works.
Sales velocity (30% weight for most businesses) Calculate units sold per month divided by average inventory on hand. This gives you true velocity rather than just raw volume. A product selling 100 units monthly with 20 on hand scores better than one selling 200 units with 150 sitting in storage. Gross margin percentage (25% weight) Not just markup—factor in all costs including inbound freight and processing. A lot of businesses discover their "profitable" SKUs barely break even once handling costs get included. Pull actual landed costs from your last three months of invoices. Return rate impact (20% weight) Returns kill profitability in ways most scoring models ignore. Calculate: (return rate × average processing cost) + (restocking time × carrying cost per day). A 15% return rate on a $50 item with $8 processing costs creates a $3.20 hidden loss per sale before you even account for the inventory tied up during inspection and restocking. Carrying cost burden (25% weight) Space matters more than most businesses realize. Calculate monthly storage cost per cubic foot, then multiply by each SKU's space requirement and average inventory level. Include insurance, utilities, and labor for cycle counts. That bulky seasonal item taking up 8 cubic feet for 10 months might cost $240 annually just to sit there.
The formula looks like this: SKU Score = (Sales Velocity × 0.30) + (Margin % × 0.25) - (Return Impact × 0.20) - (Carrying Burden × 0.25) Adjust weights based on your constraints. Businesses with limited warehouse space might push carrying costs to 35%. Those with high customer acquisition costs might prioritize sales velocity at 40%.
Setting go/no-go thresholds based on business context
Raw scores mean nothing without context. The thresholds that work for a specialty food distributor won't make sense for an electronics retailer.
Never run out of stock or overorder again.
Listoly streamlines inventory workflows to keep your business stocked and profitable.
- Real-time stock tracking
- Automated reorder alerts
- Supplier and purchase management
No credit card required
Immediate elimination candidates (bottom 10-15% of scores) These SKUs are actively hurting profitability. They typically show negative contribution margins once you factor in real carrying costs. One auto parts distributor found around 180 SKUs in this category—mostly obsolete model-specific parts held "just in case" for years. Review required (next 20-25%) These need a closer look before any decisions. Check for bundle dependencies (removing one kills a profitable set), customer concentration (one major buyer ordering quarterly), seasonal patterns you might have missed, and vendor minimum requirements that affect other SKUs. Protected SKUs (top 60-65%) Leave these alone during your pilot. They're generating profit and don't need your attention right now.
Some SKUs override scoring entirely. Gateway products that bring in new customers, loss leaders that drive basket size, or items tied to key contracts stay regardless of their score. Mark these as "strategic holds" in your system and don't second-guess them.
The pilot cleanup approach that minimizes risk
Never eliminate more than 5-8% of SKUs in your first pass. The hidden dependencies will catch you off guard every time.
Week 1-2: Pilot selection Choose 50-75 SKUs from your elimination candidates. Pick across different categories to spot patterns. Include some obvious dead inventory for quick wins, but also test a few borderline cases.
| SKU | Score | Last 90-Day Sales | Customers Affected | Dependencies | Decision Date |
|---|---|---|---|---|---|
| ABC-123 | -12.4 | 3 units | 2 | None identified | March 15 |
| DEF-456 | -8.7 | 0 units | 0 | Part of Kit-789 | March 15 |
Week 3-4: Customer communication For items with recent sales, contact those customers directly. You'd be amazed how often they say "we switched suppliers months ago" or "we only bought that by accident." One hardware distributor found that roughly 40% of their slow-moving SKUs had customers who already preferred alternatives—they just hadn't said anything.
Week 5-6: Execution Mark items as discontinued in your system but keep remaining stock available. Run clearance pricing at 25% off first, then 40% if needed. Document what moves and what doesn't—this data improves future scoring runs.
Week 7-8: Analysis Track these three things:
-
Revenue impact (usually less than 0.5% if you scored correctly)
-
Space freed (typically 10-15% from just 5% of SKUs)
-
Labor hours saved on counting, moving, and managing these items
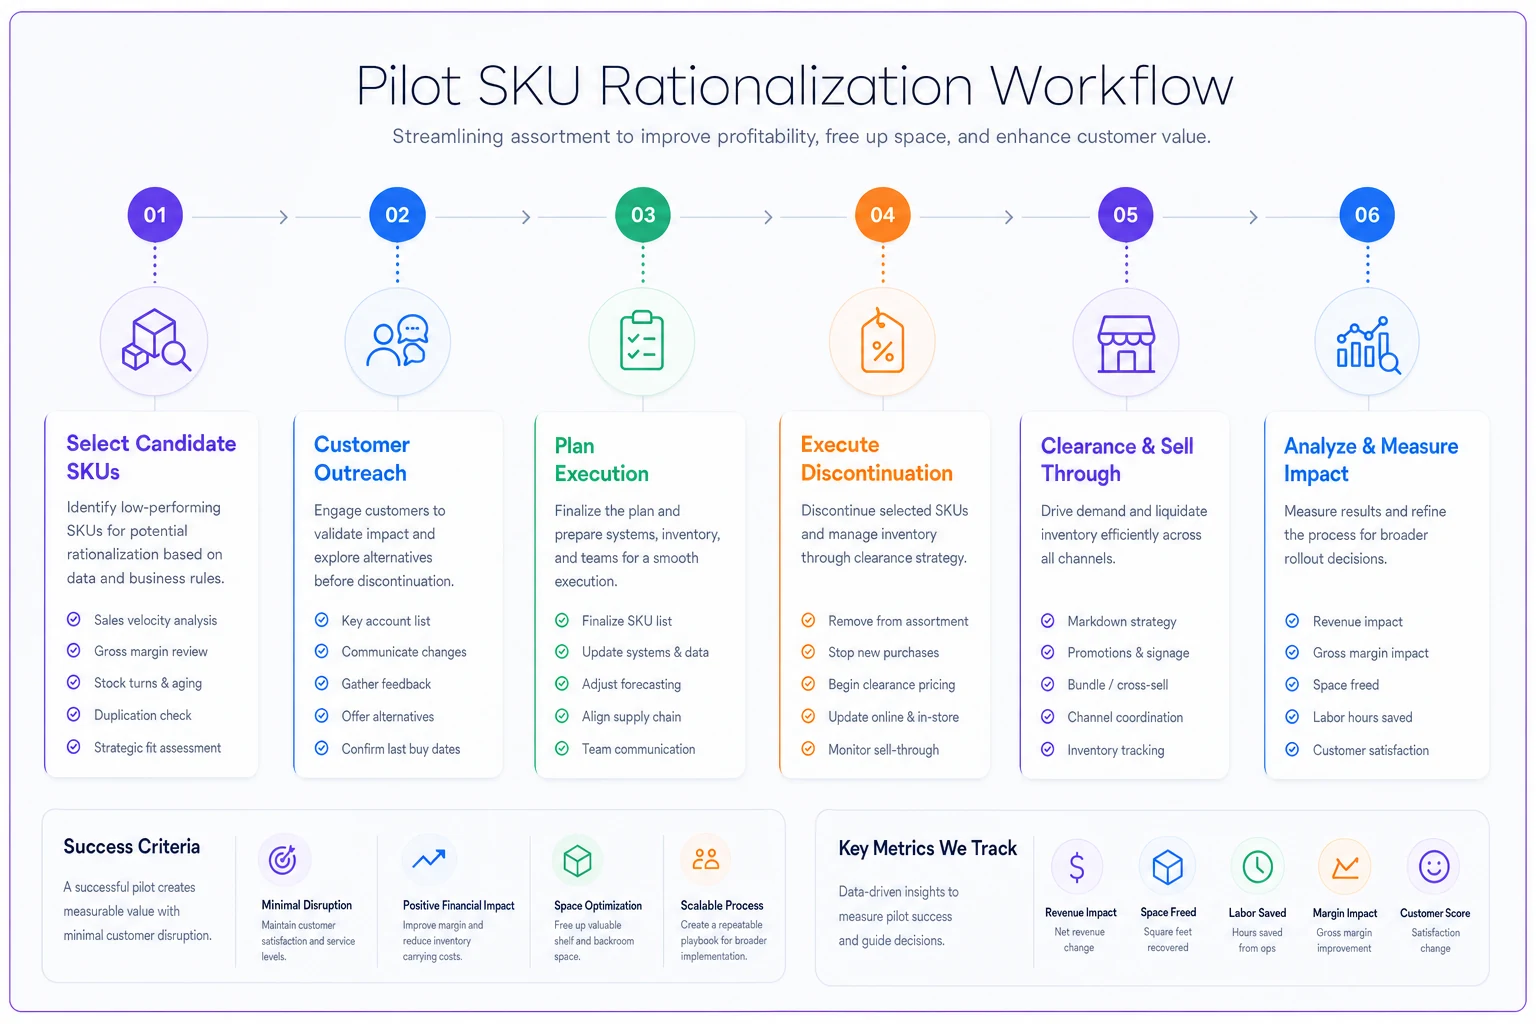
This workflow shows the typical pilot flow from selecting candidates through execution and analysis, with checkpoints for customer contact and clearance.
Calculating real ROI before and after rationalization
Most businesses underestimate the true cost of SKU bloat. The obvious carrying costs are just the beginning.
Pre-rationalization baseline costs: Calculate your current state across five categories:
-
Storage costs
Total warehouse expense ÷ total SKUs × eliminated SKU count. Include rent, utilities, insurance, and equipment depreciation.
-
Labor costs
(Cycle count time + putaway time + picking time) × hourly rate × frequency. A monthly count of 2,000 SKUs at 30 seconds each equals nearly 17 hours of labor.
-
System costs
Many businesses pay per SKU for inventory management software. Even at $0.50 per SKU monthly, eliminating 500 items saves $3,000 annually.
-
Obsolescence costs
Average write-off percentage × value of eliminated inventory. If you typically write off 3% annually and remove $50,000 in slow movers, that's $1,500 saved.
-
Opportunity costs
This is the one most calculations miss. Cash tied up in dead inventory can't buy profitable products. At a 25% margin and 4x annual turnover, $50,000 in freed cash generates meaningful additional gross profit.
Post-rationalization improvements: Beyond direct savings, track operational improvements:
-
Picking efficiency
Fewer SKUs means less travel time and fewer errors. Most operations see a 15-20% improvement in picks per hour.
-
Inventory accuracy
Fewer items to count means better counts. Accuracy typically improves from around 94% to somewhere in the 97-98% range.
-
Receiving efficiency
Less juggling of locations and overflow. Putaway time often drops 20-25%.
Track both direct cost reductions and operational improvements to get a full picture of ROI.
The ROI calculator template that actually reflects operations
A practical template that captures real costs and benefits:
Section 1: Direct Cost Savings
-
Storage
[Sq ft freed] × [$/sq ft/month] × 12
-
Labor
[Hours saved monthly] × [Loaded hourly rate] × 12
-
Systems
[SKUs eliminated] × [Cost per SKU] × 12
-
Obsolescence
[Inventory value eliminated] × [Historical write-off %]
-
Insurance
[Inventory value eliminated] × [Insurance rate]
Section 2: Working Capital Impact
-
Cash freed from inventory
[Value of eliminated inventory]
-
Redeployment return
[Cash freed] × [Gross margin %] × [Turns per year]
-
Reduced financing costs
[Cash freed] × [Interest rate]
Section 3: Efficiency Gains
-
Picking
[Daily picks] × [Time saved per pick] × [Working days] × [Hourly rate]
-
Counting
[Count frequency] × [SKUs eliminated] × [Time per count] × [Hourly rate]
-
Receiving
[Receipts per month] × [Time saved per receipt] × 12 × [Hourly rate]
Section 4: Risk Reduction
-
Reduced stockouts on key items
[Improvement %] × [Lost margin from stockouts]
-
Fewer picking errors
[Error reduction] × [Average error cost]
-
Better forecast accuracy
[Improvement %] × [Value of excess stock avoided]
A typical small business with 2,000 SKUs eliminating 150 poor performers tends to see:
-
Direct savings
$18,000-25,000 annually
-
Working capital benefit
$30,000-45,000 in freed cash
-
Efficiency gains
$12,000-18,000 in labor savings
-
Total first-year ROI
200-300% on implementation costs
Use the template sections above to plug in your numbers and test scenarios.
When rationalization creates more problems than it solves
Not every business should be aggressively cutting SKUs. If any of these apply, slow down.
High customer concentration. When your top 10 customers drive 60%+ of revenue, their SKU preferences tend to override scoring logic. One industrial supplier learned this the hard way after cutting items used by their largest client's secondary facilities.
Vendor package requirements. Some suppliers require carrying full product lines for exclusive territories or pricing tiers. Calculate whether the profitable SKUs justify keeping the underperformers.
Service-level agreements. If you've committed to stock certain items, elimination might trigger penalties that exceed what you'd save in carrying costs.
Market positioning as "complete supplier." Some businesses win specifically because they stock what competitors won't touch. A specialty fastener distributor kept around 300 low-scoring SKUs because being "the place that has everything" was central to how they competed.
Making rationalization sustainable with operational software
The biggest failure in SKU rationalization happens six months later when the catalog bloats back up. Without systematic controls, sales teams add new products, purchasing brings in "deals," and you're right back where you started.
This is where AI-powered operational software makes a real difference. Instead of manual quarterly reviews, modern platforms continuously score SKUs based on real-time performance data. They flag when new products underperform expectations or when previously solid items start declining—before the problem compounds.
Require a completed business case with projected velocity, margin, and space before approving any new SKU.
The automation handles the tedious scoring calculations, tracks pilot performance, and can suggest clearance pricing based on historical patterns. More importantly, it prevents new SKU proliferation by requiring business case documentation before additions get approved. When someone wants to add a product, they input projected velocity, margin, and space requirements. The system calculates an expected score and flags potential issues before you commit to carrying it.
Several businesses using these platforms report holding optimal SKU counts for years without the typical rebound effect. Rationalization becomes part of daily operations rather than a painful project you revisit once a year.
Start small, measure everything, then scale
SKU rationalization isn't about cutting the most products—it's about cutting the right ones while protecting what actually drives profitability. The scoring algorithm gives you data-driven confidence. The pilot approach keeps risk manageable. The ROI calculator proves the value to anyone who needs convincing.
Start with obvious dead inventory to build confidence in the process. Document everything during your pilot—both the wins and the surprises. Use those learnings to refine your scoring weights and thresholds.
The businesses that get this right treat rationalization as an ongoing discipline, not a one-time cleanup. Whether through manual quarterly reviews or automated scoring platforms, the key is making SKU decisions based on operational data rather than gut feelings or sales promises. Your warehouse space, working capital, and your team's sanity all depend on it.
Ready to optimize your inventory operations?
Join 2,000+ businesses using Listoly to reduce stockouts, save time, and improve order accuracy.