



Returns fraud prevention doesn't need expensive software or complex analytics. The most effective detection I've seen comes from basic pattern recognition and smart sampling—not sophisticated algorithms.
Most small sellers lose somewhere between 8-15% of their returns value to fraud. That's pure margin bleeding out through wardrobing, receipt fraud, switch fraud, and organized retail crime rings. The frustrating part? You probably already have the data to spot these patterns. You just need the right heuristics to make sense of it.
The four return patterns that signal fraud
Return fraud follows predictable patterns. Once you know what to look for, fraudulent returns practically announce themselves.
Pattern 1: The velocity spike
Normal customers return items sporadically. Fraudsters work in bursts. Watch for accounts or addresses that suddenly generate 3+ returns within any 14-day window. This catches wardrobing operations where someone buys items for events then returns everything afterward.
A clothing boutique in Austin started tracking return velocity last year. They found twelve customer accounts generating 40% of their total return volume. Each account showed the same pattern: quiet for weeks, then a sudden cluster of returns right after local events or holidays. Simple velocity tracking exposed a wardrobing ring costing them around $2,800 a month.
Pattern 2: The value ladder
Fraudsters test your systems. They start with small returns to understand your process, then gradually increase values once they know the weaknesses. Track the average return value by customer over time. Anyone showing steady increases over 3+ returns deserves a closer look.
Pattern 3: Cross-channel inconsistency
Buy online, return in-store. Buy with card A, return for cash to card B. Purchase from location X, return to location Y. These cross-channel patterns often indicate organized fraud, especially when combined with velocity spikes.
Pattern 4: The receipt recycler
Same receipt, multiple return attempts. Different items claimed on the same transaction. Returns without corresponding sales in your system. These patterns reveal receipt fraud that many POS systems miss entirely.
Building your inspection sampling plan
You can't inspect every return—and you shouldn't try. Smart sampling catches most fraud while keeping operations moving.
Never run out of stock or overorder again.
Listoly streamlines inventory workflows to keep your business stocked and profitable.
- Real-time stock tracking
- Automated reorder alerts
- Supplier and purchase management
No credit card required
Start with risk-based sampling tiers:
Tier 1 - Automatic inspection (100% check rate):
-
Returns over $150
-
Third return from same customer within 30 days
-
Any return without original receipt
-
Cross-channel returns (online to store, etc.)
-
Items from high-theft categories
Tier 2 - Random sampling (25% check rate):
-
Returns between $50-150
-
Second return from same customer within 30 days
-
Returns processed by new employees
-
Weekend and evening returns
Tier 3 - Spot checks (5% check rate):
-
All other returns
The real value comes from adjusting these percentages based on what you actually find. If Tier 2 sampling starts turning up problems, bump it to 40% for a couple weeks. If Tier 1 stays clean for a month, some categories can drop down.
If Tier 2 sampling starts turning up problems, bump it to 40% for a couple weeks.
A home goods retailer implemented this tiered system and found their fraud concentrated in weekend returns over $100. By moving just that segment to 100% inspection, they cut fraud losses by 60% while only adding about 2 hours of labor weekly.
Setting proof thresholds without paralyzing operations
The hardest part of returns fraud prevention is knowing when you have "enough" evidence to act. Set the bar too high and fraudsters operate freely. Too low and you alienate real customers.
Green flags (process normally):
-
Original receipt + original payment method
-
Item in original packaging with tags
-
Return within standard policy window
-
Customer history shows normal pattern
Yellow flags (inspect carefully, process if passed):
-
Missing receipt but transaction found in system
-
Opened packaging on typically-opened items
-
Just outside return window (1-5 days)
-
Second return this month
Red flags (require manager approval):
-
No receipt and no transaction record
-
Damaged/worn items claimed as defective
-
Third+ return this month
-
Cross-channel with different payment method
Black flags (reject return):
-
Previous fraud attempt documented
-
Item not in inventory system
-
Receipt clearly altered or fraudulent
-
Threatening behavior when questioned
The key is documenting everything. When someone hits two yellow flags, note it. Three yellows equal one red. Two reds trigger a fraud alert for future transactions. This creates an evidence trail without requiring absolute proof upfront.
Simple metrics that reveal fraud patterns
You don't need a data scientist. Four metrics monitored weekly will catch most schemes.
1. Return rate by day and time
Plot your return percentage (returns ÷ sales) by hour and day. Fraud often clusters during shift changes, busy periods, or when specific employees work. One sporting goods store found 70% of their fraudulent returns happened Sunday evenings when their newest cashier worked alone.
2. Customer lifetime value including returns
Calculate: (Total purchases - Total returns) ÷ Number of transactions Anyone with a negative lifetime value needs investigation. Sort customers by this metric monthly. The bottom 10% usually contains your fraud cases.
3. Return rate variance by product category
Some categories naturally have higher return rates. But when one category suddenly spikes well above its average, something's wrong. Track each category's rolling 30-day return rate and investigate anything exceeding 1.5x the historical average.
4. Employee-specific return patterns
Track returns processed per employee per shift. Watch for employees processing significantly more returns than average, clustering of high-value returns to specific staff, or employees who never flag anything suspicious.
This isn't about accusing people. Sometimes fraudsters identify and target less experienced employees on purpose. The pattern tells you where to focus training or support.
The inspection process that actually works
Physical inspection catches what data misses. But inconsistent inspection wastes time and misses fraud.
Step 1: Pre-inspection data check (30 seconds)
-
Pull up original transaction
-
Check customer return history
-
Verify item SKU matches receipt
Step 2: Physical verification (45 seconds)
-
Match item serial/tag to receipt
-
Check for wear, damage, or alteration
-
Verify all components present
Step 3: Pattern check (15 seconds)
-
Compare to known fraud patterns
-
Check against current fraud alerts
-
Note any yellow flags
Step 4: Decision documentation (30 seconds)
-
Record inspection result
-
Note any concerns
-
Update customer profile if needed
Total time: roughly 2 minutes per inspection.
The process seems basic because it is. The power comes from consistency. When every flagged return gets the same treatment, patterns emerge fast.
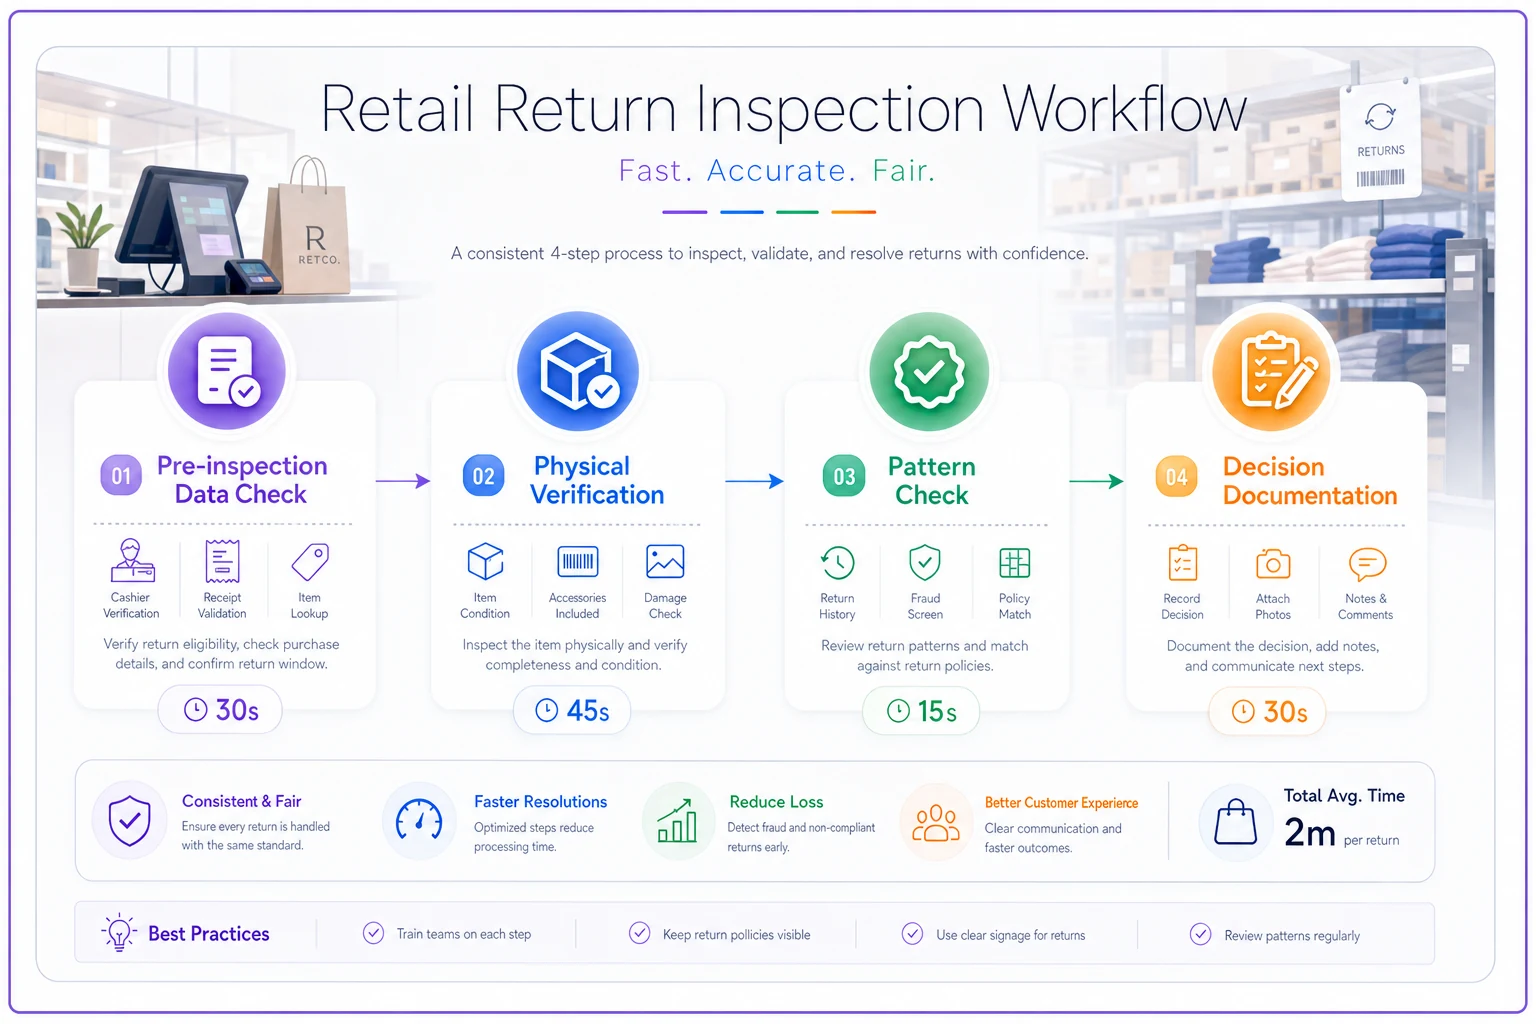
Visualizing the steps helps keep inspections consistent across staff and shifts.
A marketplace with 20 sellers implemented this process and within three weeks identified a fraud ring targeting electronics sellers with fake defective claims—switching broken units for working ones, costing sellers roughly $4,000 a month.
Building red flag triggers without complex systems
A simple spreadsheet with conditional formatting can automatically surface problems. No fancy software required.
Track these data points for each return:
-
Customer name/ID
-
Return date
-
Original purchase date
-
Item category
-
Return value
-
Return reason
-
Processing employee
-
Inspection result
Set automatic flags for:
-
Same customer appearing 3+ times in 30 days
-
Return values exceeding $150
-
Returns processed 30+ days after purchase
-
Multiple returns with same reason code
-
Customers with lifetime value below -$100
The spreadsheet turns red when thresholds are hit. Simple, visual, effective.
For businesses processing 50+ returns daily, manual tracking starts to break down. That's where automated inventory systems help track these patterns alongside regular inventory reconciliation. But for most small sellers, a well-structured spreadsheet catches the majority of fraud attempts.
Protecting against organized retail crime
Organized retail crime operates differently than individual fraudsters. They probe for weaknesses systematically, then exploit them hard.
ORC groups typically follow this pattern:
Week 1-2: Testing phase Multiple individuals make small purchases and legitimate returns. They're mapping your systems, employee habits, and inspection consistency.
Week 3-4: Escalation phase Return values increase. They test edge cases—missing receipts, cross-channel returns, different payment methods. They find the weaker staff or slower time periods.
Week 5+: Exploitation phase High-volume, high-value returns start rolling in. Multiple individuals hit multiple locations. By now they know exactly which stores, employees, and times offer the least resistance.
The defense requires connecting dots across seemingly unrelated transactions:
-
Multiple "different" customers with similar return patterns
-
Addresses that are slight variations of each other
-
Payment methods cycling through the same small set
-
Return reasons using nearly identical phrasing
-
Customers who know your return policy better than your staff
One small electronics chain spotted an ORC ring when five "different" customers all used variations of the same excuse: "Bought for elderly parent who couldn't figure it out." The phrasing was too consistent to be coincidence.
When to break your own rules
Rigid fraud prevention creates bad customer experiences. Know when to override your systems.
Accept the return despite red flags when:
-
A long-term valuable customer has one unusual return
-
There's a genuine product defect you're aware of
-
Shipping or handling damage is clearly verifiable
-
The customer gives a reasonable explanation for the flags
Reject despite green flags when:
-
The item is clearly counterfeit
-
The customer becomes threatening or abusive
-
There's previous documented fraud by the same person
-
The return would violate legal requirements
The goal isn't zero returns or maximum friction. It's protecting margins while keeping customer trust intact.
Training your team without creating paranoia
Employees need to spot fraud without treating every customer like a criminal. That balance requires intentional training.
Focus on patterns, not suspicion:
-
"If you see X, check Y" instead of "Watch out for fraudsters"
-
"This pattern often means..." rather than "This customer might be lying"
-
"Let's verify together" instead of "I don't trust this return"
Role-play common fraud scenarios monthly. Employees who've practiced handling these situations make better decisions under pressure and feel less anxious when something feels off.
Share wins. When someone catches fraud, celebrate the catch without making customers the enemy. "Sarah noticed a pattern that saved us $400" lands better than "Another scammer tried to rip us off."
The hidden patterns most businesses miss
Certain patterns consistently slip through standard checks:
The gift return shuffle: Customer A buys items. Customer B returns them claiming they were gifts, wanting store credit since they don't have receipts. Customer A and B are the same person using the credit for untraceable purchases.
The warranty exhaustion play: Repeatedly buying and returning the same item type just before warranty expiration, effectively getting free replacements. Common with electronics and appliances.
The size rotation scheme: Buying multiple sizes, keeping one, returning the rest. Looks legitimate in isolation, but some organized groups do this systematically to tie up inventory and force markdowns they then exploit.
The marketplace arbitrage: Buying on deep discount and returning at full price to a different channel. Or buying from your store and returning counterfeit versions while reselling the originals.
These hide because they look like normal customer behavior individually. Only pattern tracking across time reveals what's actually happening.
Building your fraud prevention scorecard
Track these metrics monthly:
| Metric | Formula | Target |
|---|---|---|
| Fraud Detection Rate | Fraud attempts caught ÷ Total fraud attempts (estimated) | 75% or higher |
| False Positive Rate | Legitimate returns flagged ÷ Total returns flagged | Under 20% |
| Return Processing Time | Average time from return initiation to completion | Under 5 minutes for green flags |
| Fraud Loss Rate | Value of successful fraud ÷ Total sales | Under 0.5% |
| Customer Satisfaction Score | Survey score for return experience | Maintain or improve despite new measures |
If fraud losses drop but satisfaction tanks, your measures are too aggressive. If satisfaction stays high but fraud keeps climbing, you're being too lenient. The sweet spot keeps both moving in the right direction.
Starting your fraud prevention system tomorrow
Don't build everything at once.
First, implement tiered inspection for one week. Just categorize returns into the three tiers and inspect accordingly. Don't change anything else. Get a baseline fraud detection rate.
Second, add pattern tracking in week two. Start recording the basic data points in a spreadsheet. Look for velocity spikes and value ladders. You'll spot the first patterns within days.
Third, set your proof thresholds in week three. Define your red, yellow, and green flags based on what you've learned. Start applying them consistently.
The Austin boutique owner started with just velocity tracking. That single metric exposed enough fraud to justify building out the rest of the system.
Making fraud prevention sustainable
The best fraud prevention runs quietly in the background. Customers don't feel scrutinized. Employees aren't burdened. But fraudsters hit walls at every turn.
That balance comes from embedding checks into natural workflows rather than bolting them on as extra steps. Inspection becomes part of return processing. Fraud flags live inside your normal inventory systems.
Returns fraud prevention for small businesses doesn't require major investment. It needs consistent observation, smart sampling, and clear thresholds. The patterns are already in your data. The fraudsters are already in your store. The question is whether you'll build simple systems to catch them or keep bleeding margin through losses that were preventable all along.
Start with velocity tracking this week. Add sampling tiers the week after. Build from there based on what you find. Businesses that implement these heuristics typically see fraud losses drop 40-60% within two months—not through expensive software, but by systematically applying simple patterns to spot what was hiding in plain sight.
Ready to optimize your inventory operations?
Join 2,000+ businesses using Listoly to reduce stockouts, save time, and improve order accuracy.