



Most small teams manage safety stock the same way: someone opens a spreadsheet, filters to the SKUs that ran out last month, and bumps their buffers up. A few weeks later the opposite problem shows up — cash is tied up in slow movers that haven't sold in 60 days — so they trim buffers back down. This tug-of-war never ends because it treats every SKU as its own island.
The businesses that actually get safety stock under control stop thinking SKU-by-SKU and start thinking in portfolios. They sort inventory into groups, set buffer logic per group, wire up triggers that fire when reality drifts from the plan, and adjust for season and criticality on a schedule instead of in a panic. That's the whole system. The rest of this article is how the pieces connect, where they break as you grow, and what the governance rhythm looks like so it doesn't quietly rot.
Why per-SKU safety stock falls apart
The math for a single SKU isn't hard. The problem is volume of decisions. A shop with 40 SKUs can hand-tune each one. A shop with 1,200 SKUs cannot — not without a full-time analyst, which most SMBs don't have and won't hire.
So what happens in practice is uneven attention. The 30 SKUs that caused pain recently get careful buffers. The other 1,170 get whatever number was there when the item was first created — sometimes years ago, sometimes copied from a similar product on a busy Tuesday. Nobody revisits them. You end up with a catalog where a handful of items are over-managed and the long tail is running on stale assumptions.
There's a second failure mode that's less obvious. When each SKU is tuned in isolation, you lose the ability to reason about tradeoffs across the group. You can't answer "if I want 97% availability on my A-items, what does that cost me versus 90%?" because the answer is scattered across a thousand individual cells. Portfolio thinking exists mostly to make that question answerable.
Group buffers: the foundation
The first move is segmentation. You want groups that behave similarly, because similar behavior means you can apply one buffer rule to all of them and be roughly right instead of individually wrong.
Never run out of stock or overorder again.
Listoly streamlines inventory workflows to keep your business stocked and profitable.
- Real-time stock tracking
- Automated reorder alerts
- Supplier and purchase management
No credit card required
-
Velocity / value — classic ABC on either units sold or margin dollars. This tells you how much a stockout costs.
-
Demand variability — how jumpy the sales are. A steady 10 units a week is a different animal from something that sells 0, 0, 40, 0, 5. This tells you how much buffer you need to hit a given service level.
Cross those two and you get a small grid. Most SMBs land on something like nine cells, but you rarely need all nine active. Here's a workable starting frame:
Most SMBs land on something like nine cells, but you rarely need all nine active. Here's a workable starting frame:
Here's a workable starting frame:
| Group | Description | Service level target | Buffer logic |
|---|---|---|---|
| A-steady | High value, predictable | 97–98% | Lead-time demand + modest z-buffer |
| A-jumpy | High value, erratic | 95–97% | Wider statistical buffer, review monthly |
| B-steady | Mid value, predictable | 92–95% | Standard buffer, quarterly review |
| B-jumpy | Mid value, erratic | 90–93% | Buffer capped by cash, watch closely |
| C-steady | Low value, predictable | 85–90% | Thin buffer, mostly reorder-point driven |
| C-jumpy | Low value, erratic | 80–88% | Minimal or make-to-order |
The specific percentages matter less than the principle: you are deliberately choosing to protect A-items and deliberately choosing to let C-items stock out sometimes because the carrying cost isn't worth it. That choice is invisible when you tune SKU-by-SKU. It becomes explicit and defensible when you set it per group.
For the actual buffer math on erratic and slow-moving items — where the normal formulas mislead you — the mechanics in our piece on reorder points and safety-stock rules for slow-moving and intermittent SKUs fill in the detail this section deliberately skips. Groups tell you how hard to protect. The formula tells you the number.
A quick note on how many groups is too many
More segments feels more precise. It usually isn't. Once you get past a dozen or so active groups, you're back to per-SKU management with extra steps — nobody remembers what "B-jumpy-seasonal-import" is supposed to mean, and the rules blur. Fewer, cleaner groups that everyone understands beat a beautiful taxonomy nobody maintains.
Escalation triggers: the part everyone skips
Group buffers are static. Reality isn't. A supplier's lead time creeps from 12 days to 19. A product goes viral for two weeks. An import shipment gets stuck at port. Your carefully tuned buffers were built for the old world, and they don't know the world changed.
Escalation triggers are the connective tissue between your static plan and live conditions. The idea is simple: define measurable conditions that, when crossed, kick a SKU or group out of its normal handling and into a review. You're not trying to automate the decision — you're trying to make sure a human looks before the shelf goes empty.
-
Lead-time drift — actual receipt lead time exceeds the planned figure by more than ~30% across the last 2–3 POs. This is the single most common cause of "we followed the plan and still stocked out."
-
Demand spike — trailing 2-week sales exceed the buffer's assumed weekly demand by some multiple (2x is a reasonable starting line for A-items).
-
Consecutive near-misses — a SKU dips into safety stock three replenishment cycles in a row. One dip is noise; three is a signal the buffer is set too low.
-
Sustained overstock — on-hand covers more than X weeks of demand for N weeks running. This trigger protects cash and catches C-items that quietly ballooned.
-
Fill-rate breach at the group level — an entire group falls below its service target for the month. This one catches systemic problems a single-SKU view would miss.
The mistake most teams make isn't a lack of triggers — it's triggers with no owner and no action. A dashboard turns red and everyone assumes someone else is handling it. A trigger without a named owner and a defined next step is decoration. Each one needs to answer: who gets pinged, what do they check, and what's the decision they're allowed to make?
This is where lightweight operational software genuinely helps, not as a magic fix but as a monitor that never gets busy or forgets. Watching lead-time drift and near-miss patterns across hundreds of SKUs is exactly the kind of tedious, continuous checking that people do badly and systems do well. A platform that flags the trigger and routes it to the right person keeps the judgment human while removing the part humans reliably drop — noticing in time.
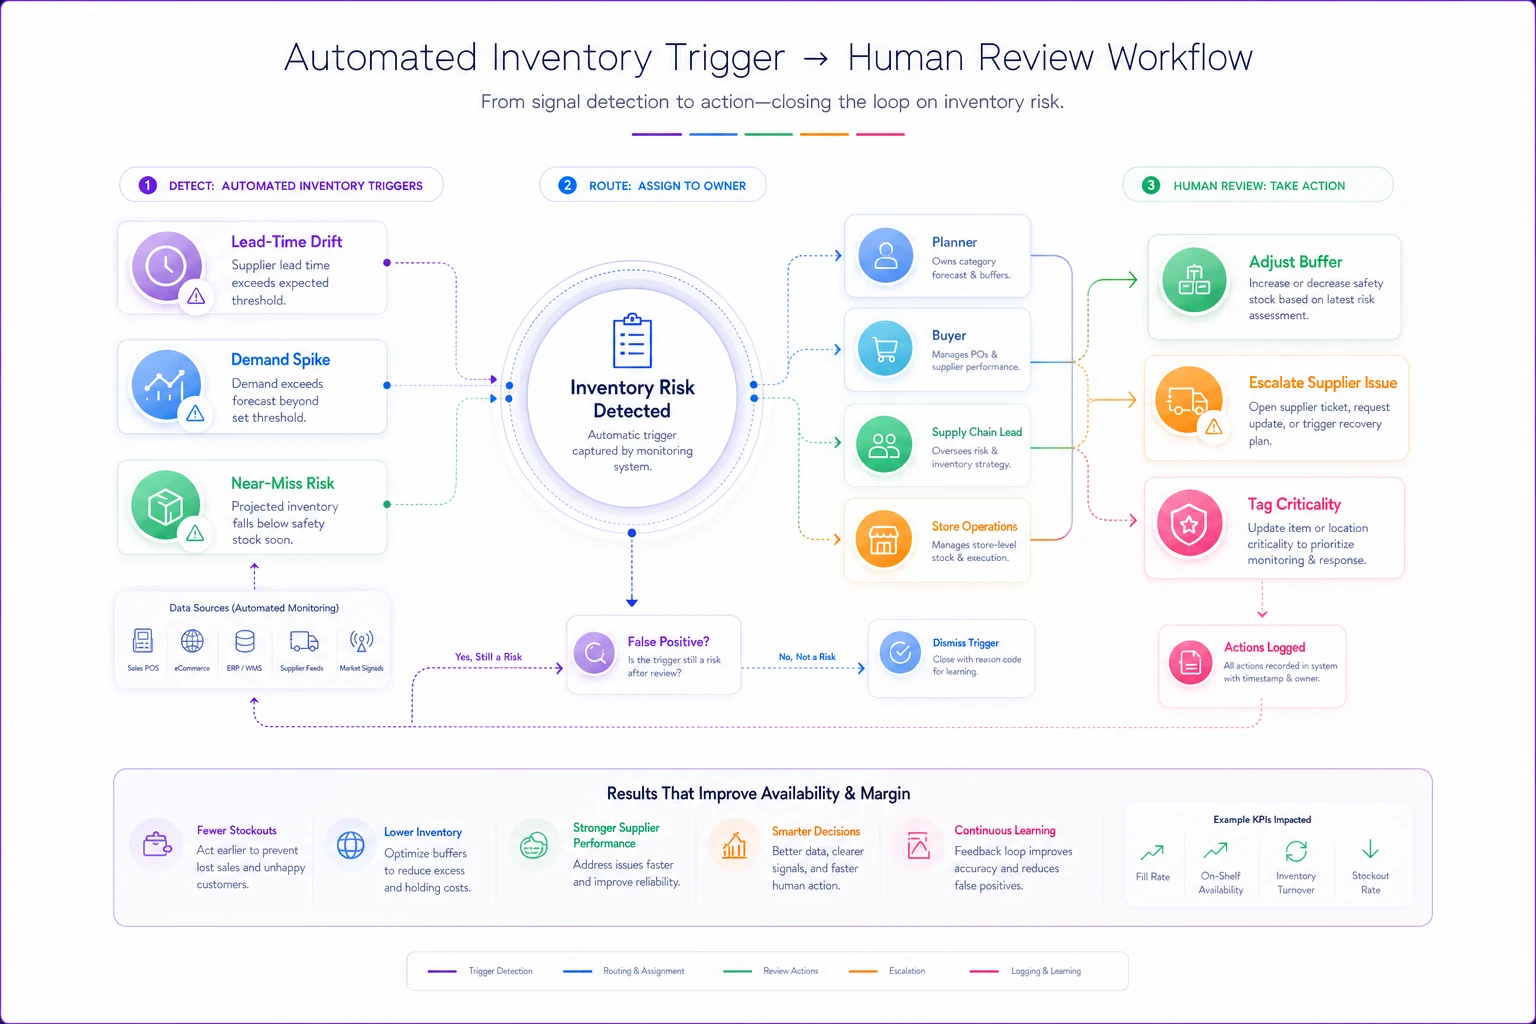
Here’s a quick flow of how triggers should route to an owner.
Seasonal and criticality adjustments
Two adjustments sit on top of the group buffers and modify them temporarily or by exception.
Seasonal adjustment is a multiplier applied to buffers ahead of known demand shifts. If your Q4 runs 3x your Q2 for gift-type items, a buffer sized for average demand is dangerously thin come November. The clean way to handle this is a seasonal calendar per group — not per SKU — that lifts or lowers buffers on set dates. The lift should go up before the season and, just as importantly, come back down after. Teams are generally good at ramping up for the holidays. They're terrible at ramping back down, which is how January becomes a warehouse full of stuff you're now discounting.
Criticality adjustment is about consequences, not sales volume. Some items are low-volume but catastrophic to run out of — a component that halts a kit, a part a service tech can't work without, a compliance-required item. These get a buffer bump regardless of what ABC says, because the cost of a stockout isn't measured in lost sales; it's measured in a stalled order, an angry customer, or a job you can't invoice.
A useful habit: tag criticality as a separate flag from velocity. A C-volume item can be A-criticality. If you fold everything into one score you lose the distinction, and that distinction is exactly what saves you from the "how did we run out of that cheap little thing?" disaster.
A portfolio worked example
Here's a concrete run through the logic so it's not all abstract.
Take a regional distributor with around 800 active SKUs and roughly $40k in monthly COGS. They sort into groups and find:
-
~60 A-items driving close to 55% of margin
-
~180 B-items
-
the rest a long C tail
Before portfolio rules, they carried roughly 6 weeks of inventory blanket across everything, because a flat "6 weeks" was easy to explain. Fill rate sat around 91% overall, but the pain was concentrated — a handful of A-items stocked out repeatedly while a pile of C-items hadn't moved in a quarter.
-
A-steady and A-jumpy buffers went up, pushing those items toward a ~4–5 week cover with a wider statistical margin on the jumpy ones. Stockouts on top items dropped from a recurring monthly headache to occasional.
-
C-items got cut hard — many down to 2 weeks or moved to order-on-demand. A slice of the long tail got flagged for possible removal entirely.
-
Net inventory value dropped somewhere in the 12–15% range, mostly out of the C tail, while service on the items that actually drive margin improved.
The interesting part isn't the numbers — it's that total inventory came down while availability on important stuff went up. That only happens when you stop treating all SKUs the same. A flat buffer forces you to over-protect the tail to protect the head. Groups let you spend your buffer where it earns its return.
The governance cadence
None of this survives without a rhythm to maintain it. Buffers drift out of date the moment demand or lead times shift, and without a review schedule you're right back to stale numbers within a couple of quarters. Here's a cadence that holds up for small teams without turning into a full-time job:
-
Weekly — review fired triggers only. Not the whole catalog. Just the SKUs and groups that crossed a threshold this week. Owner acts or documents why not.
-
Monthly — group-level fill rate and inventory value review. Are any groups missing their service target? Is any group's cover creeping up? This is where you catch systemic drift.
-
Quarterly — re-segment. SKUs migrate between groups as they mature, decline, or take off. A launch item that was A-jumpy six months ago might now be B-steady. Re-running the ABC and variability sort quarterly keeps the groups honest.
-
Pre-season — apply seasonal multipliers per the calendar, and set the reminder to reverse them afterward.
-
Annually — revisit service-level targets and the group structure itself. Did last year's targets match what the business actually needed? Adjust the whole frame, not just the numbers inside it.
The trap is the quarterly re-segmentation. It's the step that gets skipped because it's the least urgent — nothing breaks the week you miss it. But skip it for a year and your groups no longer describe your catalog. Items end up in the wrong buckets, buffers are protecting the wrong things, and the whole system slowly reverts to the noise you built it to fix. If you protect one item on this list, protect the re-segmentation.
If you protect one item on this list, protect the re-segmentation.
The replenishment side of this — how buffers actually turn into purchase orders when lead times won't sit still — is its own discipline, and the approach in our replenishment playbook for variable lead times pairs directly with the group logic here.
When this makes sense — and when it doesn't
Worth building when you've crossed roughly 150–200 SKUs, you have more than one clear velocity tier, and you're feeling the specific pain of stocking out on important items while sitting on dead stock. That combination is the signal that flat buffers have hit their ceiling.
Overkill when you carry 40 SKUs and can genuinely hold the whole catalog in your head. Grouping adds structure you don't need yet, and structure has a maintenance cost. Tune your handful of items directly and revisit when the catalog grows.
Skip the fancy version if you don't have clean sales and receipt history. Group buffers are only as good as the demand and lead-time data feeding them. If your numbers are messy, fixing data quality comes first — segmentation built on bad data will just sort your SKUs into confidently wrong buckets.
Bringing it together
A portfolio safety-stock strategy isn't a formula — it's a small set of connected habits. Groups decide how hard to protect. Triggers catch when reality drifts from the plan. Seasonal and criticality adjustments handle the exceptions the base groups can't. And the governance cadence keeps all of it from quietly going stale.
The reason this beats per-SKU tuning has nothing to do with sophistication and everything to do with attention. You have a fixed amount of attention to spend on inventory. Per-SKU management spreads it thin and unevenly. The portfolio approach concentrates it — a lot on the triggers that fired and the groups that missed target, very little on the thousand items behaving exactly as expected. That's the whole trade, and for a small team without a dedicated analyst, it's usually the difference between inventory that runs the business and a business that spends its week running after inventory.
Ready to optimize your inventory operations?
Join 2,000+ businesses using Listoly to reduce stockouts, save time, and improve order accuracy.