


Most returns processes break at the same place: the moment a box hits the receiving bench and someone has to decide what this thing is now. Not what it was sold as — what it's actually worth after a customer touched it, used it, repacked it badly, and sent it back. That decision gets made by whoever's standing there, usually in under thirty seconds, and it's almost never written down anywhere finance can trace.
The result is a pile of returned goods sitting in a corner labeled "deal with later," a warehouse that thinks it has sellable stock, and a bookkeeper who has no idea the inventory asset on the balance sheet is quietly overstated. For small and medium businesses, returns valuation refurbishment isn't a side process — it's where real money leaks out, invisibly, month after month.
This is about building a disposition decision that's repeatable, a refurb path that doesn't eat your labor budget, and an accounting handoff that actually ties out. Nothing fancy. Just the thresholds, the SOPs, and the journal mappings that let a two- or three-person team process returns at speed and know what they recovered.
The real problem: a return has no value until someone assigns one
A new SKU has a cost. A sold unit has a revenue line. A return sits in a weird in-between state — it's physically back in your building, but financially it's a question mark. Was the refund already issued? Is the item resellable? Does it go back to A-stock, drop to B-stock, get refurbished, get parted out, or hit the dumpster?
What shows up repeatedly across small operations is that nobody owns this valuation call. The warehouse decides physically ("looks fine, put it back"), finance decides financially ("we refunded it, write it off"), and the two never reconcile. So you get items physically restocked as full-value A-stock that were financially written to zero. Or the reverse — perfectly sellable returns written off because no one trusted their condition.
The fix starts with accepting one thing: disposition and valuation are the same decision. Where the item goes physically determines what it's worth on the books. If your SOP separates those two, you'll never tie out.
Build the disposition decision around evidence, not opinion
The disposition call should hinge on evidence a non-expert can capture in under a minute. That means photo evidence and simple test checks, with thresholds that map directly to a destination and a recovery value.
Never run out of stock or overorder again.
Listoly streamlines inventory workflows to keep your business stocked and profitable.
- Real-time stock tracking
- Automated reorder alerts
- Supplier and purchase management
No credit card required
-
Cosmetic condition — captured with 2–3 photos (front, back, any visible damage)
-
Functional status — a pass/fail test check appropriate to the product
-
Packaging completeness — original box, accessories, manuals present or missing
Keep the test checks dead simple and standardized per product category. For electronics, it might be "powers on, connects, no error codes." For apparel, "no stains, no odor, tags present or reattachable." For tools, "runs, no cracked housing, blade/bit intact." The goal is a check a seasonal hire can run without judgment calls.
Then you map those three signals to a disposition grade and a recovery percentage of original cost:
| Grade | Cosmetic | Functional | Packaging | Disposition | Recovery (% of cost) |
|---|---|---|---|---|---|
| A | Like-new | Pass | Complete | Back to A-stock | 90–100% |
| B | Minor marks | Pass | Missing accessories | Open-box / B-stock | 55–75% |
| C | Visible wear | Pass | Incomplete | Refurb queue | 30–50% (post-refurb) |
| D | Damaged | Fail | — | Parts / liquidation | 5–20% |
| X | — | Fail, unsafe/contaminated | — | Scrap | 0% |
The recovery percentages aren't gospel — you calibrate them to your actual resale data over a few months. But having any documented band beats the "looks fine to me" method, because now the number flows to finance automatically and you can audit it later.
One pattern worth flagging: the X grade exists for a reason. Items that fail on safety or contamination grounds should never re-enter sellable stock, and that call needs to be unambiguous. If you deal with anything perishable, consumable, or safety-sensitive, pair this with a hard quarantine step — the low-overhead quarantine and returns workflow covers how to stop contaminated stock from leaking back onto shelves.
Quarantine X-grade items immediately and label them clearly to prevent accidental restocking.
Here's a simple workflow image to visualize the disposition decision.
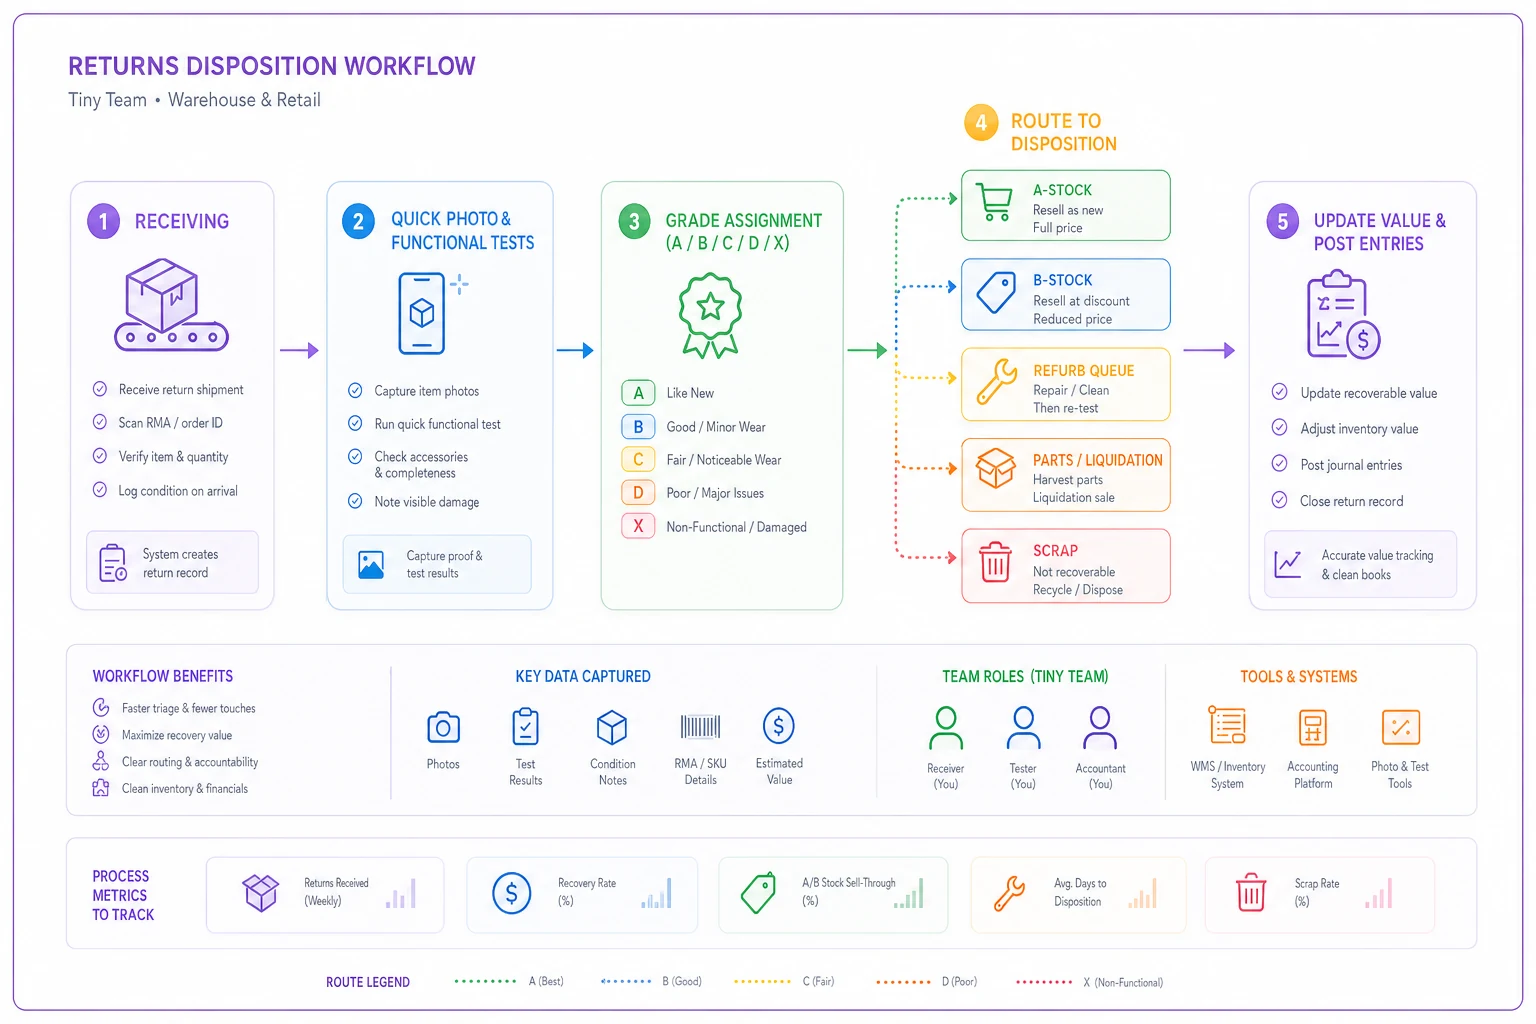
The grade table above is a starting point. Most teams end up tweaking the recovery bands after a quarter of real data. That's expected — the point is to have a number to calibrate against, not to guess correctly on day one.
Photo evidence and test checks: the thresholds that actually matter
The temptation is to over-document. Don't. For a tiny team, every extra photo or test step is labor you can't spare, so you want the minimum evidence that protects the valuation and holds up if a customer or auditor questions it.
Thresholds help here. Not every return needs the same scrutiny. Tie evidence depth to value:
-
Under ~$25 item cost — single photo, visual check only. If it looks resellable, grade A or B and move on. The cost of thorough testing exceeds the recovery upside.
-
$25–$150 item cost — 2–3 photos plus the standard functional test check for the category. This is the bulk of most SMB returns and where documentation earns its keep.
-
Over ~$150 item cost — full photo set, functional test logged with result, serial/lot capture, and a second-person sign-off before anything above grade C gets restocked.
The reason this tiering matters: in real operations, teams either document everything (and fall behind, so the backlog grows and nothing gets processed) or document nothing (and can't defend their numbers). Value-based thresholds let you spend your attention where recovery is actually at stake.
A quick note on photo discipline — the photos aren't just for grading. They're your evidence trail if you later pursue vendor credit on a defective return. If a return is actually a supplier defect rather than a buyer's-remorse case, that same photo set feeds straight into your supplier claim. The RMA-to-vendor runbook walks through the evidence checklist that speeds up getting credit back from vendors, and it's worth routing defective returns down that path instead of eating the loss.
Refurb SOPs that don't quietly lose money
The refurb queue — grade C items — is where small teams bleed labor without realizing it. Someone spends 40 minutes cleaning, testing, and repackaging an item that recovers maybe $18. That's a loss disguised as productivity.
> Refurb only if: (Expected resale value − refurb labor cost − parts/materials) > liquidation value
A typical example looks like this. You've got a returned kitchen appliance, original cost $90, that grades C. Expected B-stock resale after refurb is around $58. Refurb takes about 25 minutes of labor (call it $9 at a loaded rate) plus a $4 replacement part. Liquidation value if you just dump it in a pallet lot is maybe $12.
-
Refurb path
$58 − $9 − $4 = $45 net recovery
-
Liquidation path
$12
Clear win — refurb it. But flip the numbers: if resale were only $22 and the part cost $11, refurb nets $2 versus $12 liquidated. Liquidate it. The math changes the answer, and without the threshold written down, your tech's instinct ("I can fix this") will override the economics every time.
Your refurb SOP should include:
-
A per-category standard refurb time (so you can estimate labor before starting)
-
A parts kit list with costs for the common failures
-
A "stop" rule — if refurb exceeds estimated time by more than ~50%, pause and re-evaluate against liquidation
-
A re-grade step after refurb (an item that comes out of refurb gets re-photographed and regraded, usually landing at B)
That last step matters more than it sounds. Items that go into refurb as grade C come out as something else, and your recovery value has to update. If your SOP doesn't force a re-grade, the item keeps its C-stock valuation forever even though it's now sellable at B-stock prices — understating your recovery and skewing your inventory asset.
Recoverable-value tracking: the number finance actually needs
The handoff that breaks most often: the warehouse knows an item is now B-stock worth ~$55. Finance still has it on the books at $90 original cost, or worse, wrote it fully off when the refund was issued. Neither number is right.
The concept that fixes this is recoverable value — a single tracked number per returned unit representing what you realistically expect to get back from it, after disposition and any refurb. This is the number that should hit your inventory asset account, not original cost and not zero.
The flow looks like this in practice:
-
Return received → booked at zero recoverable value initially (you don't know what it's worth yet)
-
Disposition graded → recoverable value assigned from the grade band
-
Refurb completed (if applicable) → recoverable value updated to post-refurb estimate
-
Item sold or liquidated → actual recovery recorded, variance against estimate logged
Step 4's variance log is the quietly valuable part. Over a quarter, comparing estimated recovery to actual sale price tells you whether your grade bands are calibrated. If grade B items keep selling for 40% of cost when you valued them at 65%, your bands are optimistic and your inventory asset is overstated. Tighten them.
Journal mappings, worked out
This is where most "returns guides" wave their hands. Let's be concrete. Assume you already issued the customer refund (that's a separate entry against revenue). The returned goods need their own treatment.
When the return is received (before grading):
-
Dr. Returned Goods (holding) — $0 placeholder, or at a conservative default if you prefer
When graded to B-stock (say recoverable value $55 on a $90-cost item):
-
Dr. Inventory – B-stock
$55
-
Cr. Returns Recovery / COGS adjustment
$55
When sent to refurb (parts + labor capitalized into recoverable value, if your policy allows):
-
Dr. Inventory – Refurb WIP
cost of parts + direct labor
-
Cr. Parts inventory / Labor clearing
When refurb completes and regrades (recoverable value now $58):
-
Transfer Refurb WIP to Inventory – B-stock at the updated recoverable value
When the B-stock unit sells for $52:
-
Normal sale entry, plus a $3 variance against your $55 estimate flows to the Returns Recovery account, flagging the optimistic grade
When an item is scrapped (grade X):
-
Dr. Returns Loss / Scrap expense
-
Cr. Returned Goods holding (removes it from any asset position)
The point isn't the exact account names — your chart of accounts will differ. The point is that each disposition grade maps to a predetermined journal path, so the warehouse's physical decision drives the accounting without the bookkeeper re-deciding anything. For month-end reconciliation, this is the difference between a clean tie-out and an afternoon of detective work reconciling what's physically in the returns area against what the books say.
A real scenario: a home-goods reseller drowning in open-box
A small online reseller of home and kitchen goods — roughly 300–400 returns a month across a three-person operation — had their entire returns area working on vibes. Items got eyeballed and either tossed back into A-stock or thrown onto a liquidation pallet. No grading, no recovery tracking.
Two things were happening. First, returns getting dumped back into A-stock were coming back again when the next customer received a clearly-used item sold as new — a return-on-return loop burning through shipping and support time. Second, the liquidation pallets were going out at pennies because perfectly refurbishable items were mixed in with genuine scrap.
They put in the grade bands, the value-tiered photo thresholds, and the refurb-or-not math. Nothing high-tech — a shared sheet and a labeled shelf per grade. Over about two months:
-
Return-on-return complaints dropped sharply once used items stopped going back as A-stock
-
Items they used to liquidate at roughly 8% of cost were recovering closer to 50–60% through the B-stock channel after quick refurbs
-
Month-end stopped surprising the bookkeeper, because the recoverable-value number on returns actually matched what was on the shelf
The labor cost barely moved — they were already handling every item, just without a decision framework. The gain came entirely from making the right call on each one and booking it correctly.
When this level of process makes sense — and when it doesn't
This makes sense when: your returns are more than a handful a week, your average item cost is high enough that misgrading loses real money (roughly $20+ per unit), and you have any resale channel for B-stock beyond full-price. The structure pays off fastest when you're currently either over-restocking (used items going back as new) or over-liquidating (dumping refurbishable stock).
This is overkill when: your return volume is tiny, items are low-value, or everything returned is genuinely unsellable — food that's been opened, custom items. In those cases a simple quarantine-and-scrap flow is enough, and building grade bands is just ceremony.
Who should skip the refurb part entirely: if you don't have the space, the labor, or a B-stock sales channel, don't build a refurb queue. Grade, and route everything that isn't A-stock straight to liquidation or vendor credit. A refurb process with nowhere to sell the output is just a nicer-looking pile of inventory you can't move.
Where software quietly earns its place
None of this requires a platform — a spreadsheet and labeled shelves get a small team a long way. But friction shows up in two spots: keeping the recoverable-value number synced between the physical shelf and the books, and logging the estimate-vs-actual variance so your grade bands stay honest. Doing that by hand across a few hundred returns a month is where things start slipping.
An operational platform with AI-assisted automation reduces that manual work in a pretty targeted way. It can auto-tag a disposition grade from captured photos and test results, push the right recoverable value into the inventory record, and generate the journal mapping so finance isn't re-keying anything. It also flags variance patterns automatically, so instead of noticing after a bad quarter that grade B is overvalued, you see it while you can still adjust.
The one thing to get right
If you take a single idea from this: the moment someone decides where a returned item goes physically is the moment its value is set financially. Fuse those two decisions into one documented step — grade, photo, test, recoverable value, journal path — and returns stop being a mystery pile in the corner. They become a predictable, trackable recovery stream that ties out at month-end and tells you, honestly, how much value you're pulling back out of your returns.
Start with the grade bands and the refurb math. Calibrate the recovery percentages against your real resale data over a quarter. Everything else — the journal mappings, the variance tracking, the automation — hangs off that first disciplined decision.
Start with the grade bands and the refurb math. Calibrate the recovery percentages against your real resale data over a quarter. Everything else — the journal mappings, the variance tracking, the automation — hangs off that first disciplined decision.
Ready to optimize your inventory operations?
Join 2,000+ businesses using Listoly to reduce stockouts, save time, and improve order accuracy.