

The pattern shows up every year. You run a solid Black Friday promotion, move a ton of inventory, feel good about the numbers. Then mid-December rolls around and returns start trickling back. By January, you're trying to clear holiday overstock while those November returns are still piling up in your warehouse.
What happens next determines whether you end up with clean shelves in February or mountains of dead stock eating your cash flow through spring.
Most replenishment systems treat promotions and returns as separate problems. Your reorder algorithm sees units flying off shelves during a 40% off sale and triggers a purchase order. Meanwhile, 15-30% of those promotional sales are coming back as returns over the next six weeks. The system doesn't connect these two realities until you're drowning in inventory nobody wants at full price.
The overlap window that breaks standard replenishment
Promotional periods create a specific operational problem: compressed selling windows followed by extended return periods. A typical Black Friday sale runs maybe 5-7 days. The return window stretches 30-60 days, sometimes longer if you extend holiday return policies.
During that promotion, daily velocity might spike 3-5x normal levels. Standard replenishment formulas see this spike and calculate forward demand based on recent movement. Even systems that account for promotional lift often miss the return lag.
Here's what this looks like in practice. A clothing retailer runs a 50% off sale on winter jackets in early December. They sell 400 units that week versus their normal 80. Their replenishment system — even with promotional adjustments — suggests ordering another 200-250 units to maintain coverage through the holidays.
But those 400 jackets? About 80-100 come back as returns between December 15 and January 31. Another promotion in January moves 150 units, but 30 of those return too. By February, they're sitting on 180 jackets when demand has dropped to around 20 units per week.
The math gets uglier when you factor in how returns actually flow back. They don't arrive evenly — you get waves. Right after Christmas, early January when credit card bills hit, end of January when extended holiday return windows close. Each wave disrupts your inventory position right when you're trying to plan the next promotional push.
Return multipliers by category and channel
Different product categories behave very differently during promotional return cycles. Electronics bought on promotion return somewhere around 8-12%. Apparel hits 25-35%. Shoes can reach 40% or higher, especially online where fit issues compound the problem.
Never run out of stock or overorder again.
Listoly streamlines inventory workflows to keep your business stocked and profitable.
- Real-time stock tracking
- Automated reorder alerts
- Supplier and purchase management
No credit card required
Channel matters too. In-store promotional sales return at lower rates than online orders. Buy-online-return-in-store adds another wrinkle — those returns hit your store inventory immediately but might take days or weeks to route back to fulfillable stock if they need quality checks or repackaging.
-
Flash sales (24-48 hours)
18% return rate
-
Week-long promotions
28% return rate
-
BOGO deals
42% return rate
-
Clearance (final sale)
3% return rate
The BOGO returns killed them every time. Customers would buy two pairs planning to keep one, inflating demand signals right when the company needed accurate data for spring ordering.
Product characteristics matter too. High-consideration items bought on promotion — expensive jackets, electronics — return less frequently than impulse purchases. But when they do come back, they tie up more working capital. A $200 jacket returning in January represents way more trapped cash than five $40 t-shirts.
Building promo-safe reorder thresholds
The standard approach — adjusting reorder points based on promotional lift — fails because it only looks at outbound velocity. You need thresholds that account for the full cycle: spike, return, residual demand.
Start by establishing your baseline return expectation by promotion type and product category. Not your overall return rate — the specific return behavior during and after promotions.
Pull your last three similar promotions and calculate the following:
-
Units sold during the promotion
-
Units returned within 30 days
-
Units returned within 60 days
-
Net units actually kept by customers
That net number is your real demand signal, not the gross sales figure.
Week 1 (promotion): Pause automatic reordering entirely Weeks 2-3: Set reorder point at 50% of normal Weeks 4-6: Gradually increase to 75% of normal Week 7+: Resume normal if return rate is tracking as expected
You can't just pause reordering completely or you'll stock out on items with genuine sustained demand. Some products see lasting velocity increases after promotions — customers discover them, like them, buy again at full price.
The key is graduated thresholds based on certainty levels:
High certainty threshold: Only reorder if stock drops below 1 week of non-promotional demand Medium certainty: Reorder at 2 weeks of coverage Low certainty: Hold at 4 weeks of coverage
Use the net units actually kept by customers as your primary demand signal during the return window.
Promotional replenishment workflow — from promotion start through return window to normal operations:
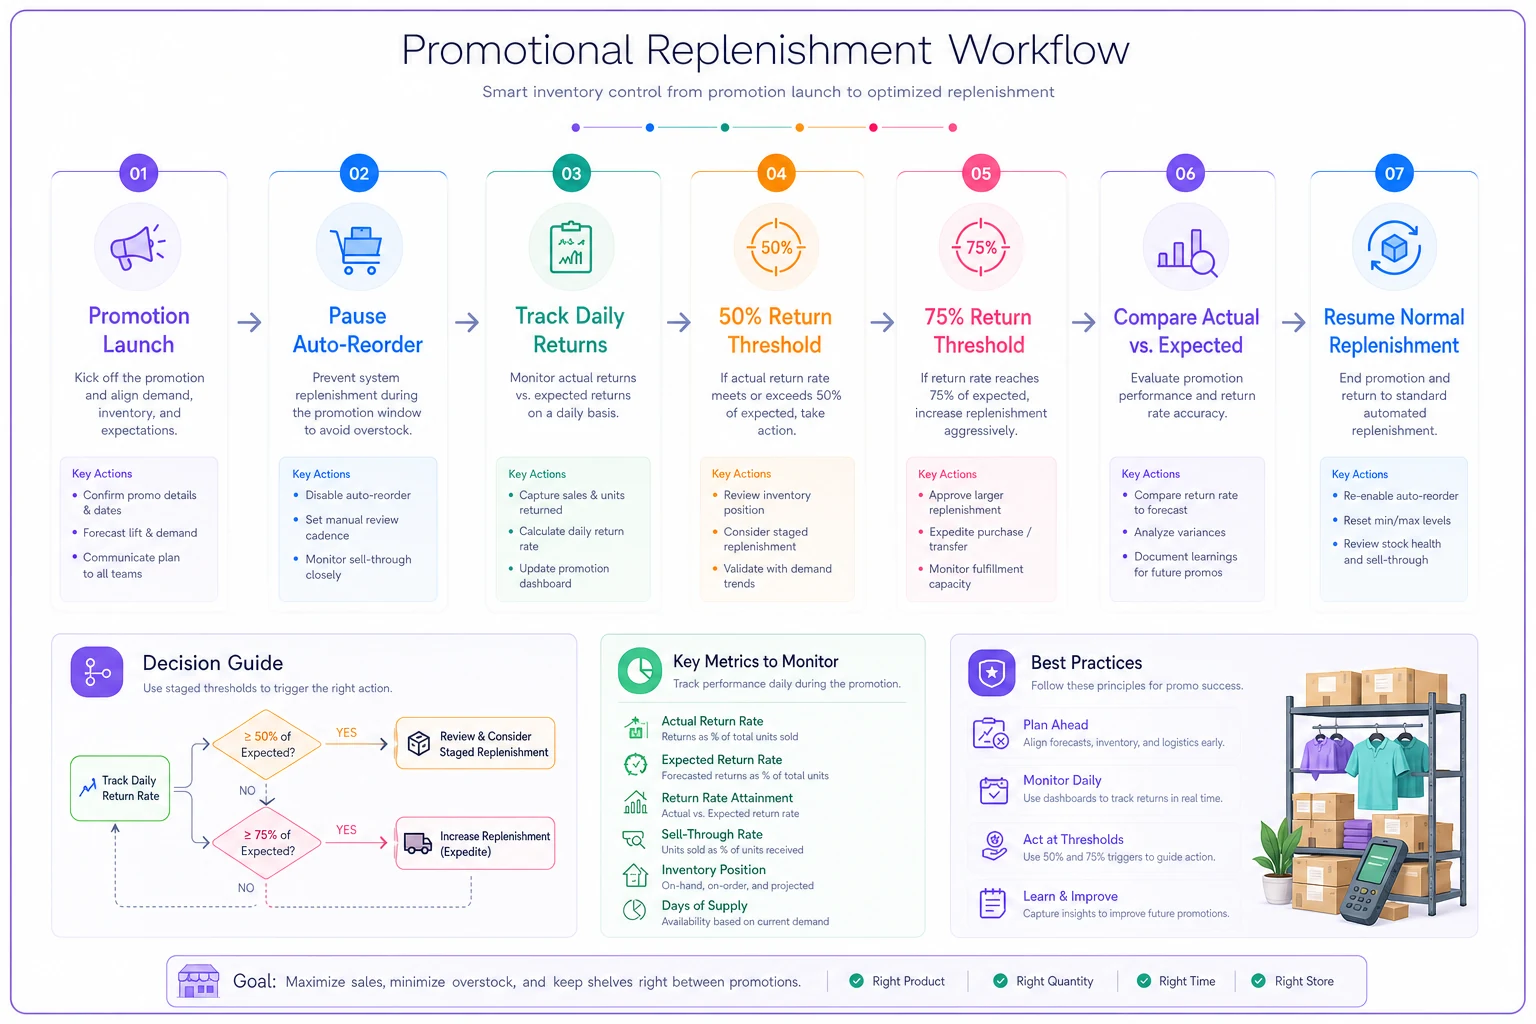
Use this flow to guide temporary reorder rules during and after promotional spikes.
During the promotional return window, you operate at high certainty only. This keeps you from completely stocking out while preventing overbuying based on inflated demand signals.
Channel throttling rules during promotional overlap
Multi-channel operations need channel-specific rules during promotion-return overlap periods. Your website, Amazon, retail stores, and wholesale accounts all behave differently during promotions.
Start by identifying which channels drive returns versus which keep inventory moving. Amazon FBA inventory comes with return processing costs and longer cash conversion cycles. Your own website might process returns faster but requires more hands-on management. Retail stores can often resell returned items immediately if they're in decent condition.
During promotion windows, throttle replenishment by channel based on return risk and processing time:
| Channel | Replenishment Throttle | Reason |
|---|---|---|
| Amazon FBA | 60% of promotional demand | Return lag + fees make overstock expensive |
| Direct website | 70% if you control returns | Faster processing gives more flexibility |
| Retail stores | 85–90% of promotional demand | Returns often go straight back to the floor |
| Wholesale | No throttling needed | Returns are the buyer's problem |
A sporting goods retailer got burned on a cross-channel promotion after pushing inventory to all channels equally during a 40% off sale. Amazon returns took three weeks to process and restock. Website returns came back faster but needed inspection. Store returns went straight to the floor. By the time everything cleared, they had 3x coverage on Amazon while stores were stocking out.
Now they pre-allocate promotional inventory by channel based on return patterns. Amazon gets less during promotions. Stores get more. The website gets a buffer allocation that can shift to either channel based on actual demand.
Real scenario: managing supplement reordering through New Year promotions
A supplement company runs a predictable promotional calendar: Black Friday, December fitness push, New Year resolution sale, Valentine's Day. Each promotion overlaps with returns from the previous one.
Their protein powder normally sells around 200 units weekly at $45. Black Friday at 40% off moves 1,400 units. Their standard system suggests reordering 600 units to maintain three weeks of coverage based on the velocity spike.
But they'd tracked their return patterns: Black Friday nutrition sales came back at 22%, clustered at days 15-25 post-purchase, and the January promotion would land right in the middle of that return window.
Instead of ordering 600 units, they throttled down. They ordered only 200 units — roughly one week of normal demand — set up daily return tracking alerts, and prepared quick-turn reorder capability if returns came in lower than expected.
Returns hit 24%, slightly above expectation. The January promotion moved 800 units with 20% returns. By February they had clean inventory levels while competitors were sitting on thousands in overstock, selling at clearance prices that destroyed margin for two full quarters.
The difference came from treating the November-January stretch as one connected operational window, not three separate promotional events.
When aggressive reordering during promotions makes sense
Not every promotion needs throttled replenishment. Some situations actually call for more aggressive reordering despite return risk.
Product launches during promotional periods can sustain elevated demand even after the promotion ends. Customers discover the product, word spreads, organic velocity builds. Throttling too hard here means missing the momentum window. This connects to the broader challenge of forecasting inventory for product launches and new SKUs with no sales history — promotional launches just add another variable to an already uncertain equation.
Items with supply constraints need different treatment. If your vendor has 16-week lead times and unreliable availability, you might need to order during promotions despite return risk. Stocking out for months usually costs more than managing some overstock.
Gift-oriented products during Q4 see lower return rates despite heavy promotional activity. People rarely return gifts they're giving to others. One candle company found their November-December return rate dropped to around 8% from their normal 18%, even with deeper discounts. They could reorder more aggressively during holiday promotions because of it.
Consumables with short shelf lives need careful balance too. Throttle too hard and you stock out and lose customer trust. Over-order and you're dealing with waste. The solution is usually smaller, more frequent orders during promotional periods rather than a binary throttle/don't throttle call.
The clearance spiral problem
A pattern that reliably destroys margins: you over-order during Black Friday. Returns pile up in December. January clearance moves some units but not enough. February deeper clearance still leaves inventory. By March, you're practically giving product away while simultaneously trying to bring in new spring stock.
Each clearance event triggers its own return cycle, creating cascading problems. That 50% off January sale generates returns in February. The 70% off final clearance in February brings returns in March. You end up managing three or four overlapping return cycles while demand for the entire product category has moved on.
First clearance: Maximum 30% off, only for items with less than 8 weeks of coverage at normal velocity Second clearance: 40-50% off, but reduce quantity available by channel Final clearance: Whatever it takes, but explicitly marked as final sale, no returns
The channel quantity reduction matters here. Maybe Amazon gets no clearance inventory because return processing is too expensive. Your website gets limited quantities. Stores get the bulk since they can manage returns more efficiently.
A home goods retailer broke their clearance spiral by implementing purchase quantity limits. Instead of letting customers buy 10 discounted throw pillows and return 8, they capped purchases at three per customer. Returns dropped from 35% to 15% on clearance items. They moved less volume per promotion but netted more kept inventory and preserved some margin in the process.
Building your return prediction model
You don't need complex software to predict promotional returns, but you do need consistent tracking. The challenge is that many systems struggle to accurately match returns to their original promotion — especially when you're already dealing with POS vs warehouse inventory mismatches.
Start with a basic tracking spreadsheet that captures promotion date and discount percentage, SKUs included, units sold by day during the promotion, returns by day for 60 days post-promotion, and final net units kept.
After three promotion cycles, patterns start to emerge. One athletic wear brand discovered their returns clustered in predictable waves: days 8-12 post-purchase (immediate regret), days 22-28 (credit card bills), and days 55-60 (end of return window).
Build separate predictions for different customer segments. New customers acquired during promotions return at higher rates than existing customers. Email subscribers return less than social media traffic. Tracking these segments refines your predictions significantly.
| Scenario | Return Rate | Use Case |
|---|---|---|
| Optimistic (low return) | 15% | Best-case planning only |
| Likely (base case) | 22% | Standard operations reference |
| Pessimistic (high return) | 30% | Reorder decisions during promotion |
Use the pessimistic case for reorder decisions during the promotion. Adjust toward the likely case as actual returns come in. This conservative approach prevents most overstock situations while keeping you flexible enough to reorder if returns track lower than expected.
Software automation for promotion-return management
Managing overlapping cycles manually across hundreds of SKUs becomes overwhelming fast. You're tracking promotional calendars, return windows, channel-specific rules, and trying to make daily reorder decisions while everything else about running the business still demands attention.
AI-powered operational software changes the equation here. Instead of manually calculating return-adjusted reorder points for every SKU during every promotion, the system tracks patterns and automatically adjusts thresholds based on what it observes — things like which products consistently see high promotional returns versus those with sticky demand, or the fact that your wool sweaters return at 40% when promoted in January but only 20% in October.
A solid platform also connects those patterns to your actual operational constraints — cash flow, warehouse space, vendor lead times. It might maintain higher stock on a profitable item with reliable demand even during promotional returns, while aggressively throttling marginal SKUs that only move on deep discount.
Where the automation really earns its keep is catching exceptions early. When return patterns deviate from historical norms — maybe a quality issue is driving unusual returns, or a competitor's promotion is affecting your velocity — you get flagged before it becomes a warehouse full of dead stock. That early warning, across a full SKU catalog, is genuinely hard to replicate manually.
Implementation priorities and next steps
Rolling this out doesn't require overhauling your entire operation at once. Start with your highest-impact SKUs — typically the top 20% that represent around 80% of your promotional volume.
-
Weeks 1-2 — Track your current state
Pull historical data on your last three major promotions. Calculate actual return rates by SKU and promotion type. Identify which items consistently create overstock problems.
-
Weeks 3-4 — Implement manual throttling
Create simple throttle rules for your top 50 SKUs. Set up return tracking alerts. Pause automatic reordering during promotion weeks.
-
Weeks 5-8 — Refine and expand
Adjust throttle percentages based on actual returns. Add channel-specific rules. Expand to the next 100 SKUs.
-
Ongoing — Systematize and automate
Build prediction models for each product category. Implement software automation for calculations. Create exception reporting for unusual patterns.
The biggest mistake is waiting to perfect the system before implementing anything. Basic throttling rules, even imperfect ones, prevent most overstock disasters. You can refine as you go.
One outdoor gear retailer started with just one rule: no reordering during Black Friday week. That single change saved them roughly $50k in carrying costs in year one. They've since built out more sophisticated return predictions, but that first crude rule delivered immediate value without requiring much effort.
The operational reality check
Promotion-return overlap isn't going away. If anything, it's accelerating as consumers expect more frequent sales and longer return windows. The businesses that hold up are the ones treating promotions and returns as one connected system, not separate events to deal with independently.
The goal isn't to eliminate promotions or tighten return policies to the point of losing customers. It's to make inventory decisions that account for the full cycle — which means accepting that some portion of your Black Friday sales will come back, planning for it, and not getting caught in the overstock-clearance-return spiral that follows when you don't.
Most small businesses can dramatically improve their position with basic throttling rules and consistent tracking. You don't need perfect predictions. You need reasonable guardrails that prevent the worst outcomes while keeping enough flexibility to capitalize on genuine demand.
Stop treating promotions and returns as surprises to react to. Build them into your replenishment planning as predictable operational patterns. Your inventory levels, cash flow, and margins will show the difference within one promotional cycle.
Ready to optimize your inventory operations?
Join 2,000+ businesses using Listoly to reduce stockouts, save time, and improve order accuracy.