


Most small warehouses aren't slotted. They're accreted. Product lands wherever there was open space the day it arrived, and three years later your fastest-moving SKU lives in the back corner next to seasonal overstock nobody's touched since two Christmases ago. Pickers know this. They compensate with memory and legs. And the cost of that compensation hides inside labor hours that never show up on a report.
This is a walkthrough for slotting a small warehouse using nothing more than a spreadsheet, a tape measure, and a couple of afternoons. No barcode overhaul, no slotting-optimization software with a five-figure license. Just velocity zoning, a repeatable pick path, and a way to actually measure whether the re-slot worked.
The specific problem: your pick path is fighting your velocity
There's a pattern that shows up in almost every unslotted small floor. You have somewhere between 400 and 2,000 active SKUs. A handful of them — call it the top 15% — drive the overwhelming majority of daily line items. But those fast movers are scattered across the whole footprint because they were placed by arrival date, not pick frequency.
So a picker filling a typical order walks something like this: front-left for item A, back-right for item B, middle aisle for item C, then back to the front for item D. The order had four lines. The walk covered most of the building.
Multiply that across your daily order volume and the waste is enormous — but invisible, because no single trip feels wasteful. It's death by a thousand steps. This usually happens when a business grows faster than its layout. You outgrew the logic of the original floor plan sometime around the point you doubled your SKU count, and nobody stopped to re-draw it.
Velocity zoning: the whole idea in one page
Velocity zoning means dividing your floor into a few zones ranked by how "expensive" each location is to reach, then putting your highest-frequency items in the cheapest-to-reach spots.
Never run out of stock or overorder again.
Listoly streamlines inventory workflows to keep your business stocked and profitable.
- Real-time stock tracking
- Automated reorder alerts
- Supplier and purchase management
No credit card required
-
Closest to the pack/ship station
-
At golden-zone height (roughly waist to shoulder — no bending, no ladders)
-
On the main travel aisle, not a dead-end spur
You don't need more than three or four zones on a small floor. Overcomplicating this is the first mistake people make. I've watched managers try to build seven velocity tiers on a 6,000 sq ft floor and then spend more time maintaining the classification than they ever saved picking.
Here's a workable zone structure:
| Zone | What goes here | Location traits | Rough % of SKUs |
|---|---|---|---|
| A (Gold) | Top movers by pick frequency | Waist-height, nearest pack station, main aisle | 15–20% |
| B (Silver) | Steady mid-velocity items | Reachable without a ladder, one aisle back | 30–35% |
| C (Bronze) | Slow but regular | Upper/lower shelves, secondary aisles | 30–40% |
| D (Dead) | Barely moves, seasonal, overstock | Back corners, high racks, overflow | 10–15% |
The number that matters is pick frequency, not sales dollars and not unit volume. A cheap $2 accessory that appears on 60% of orders belongs in Zone A even though it barely registers on your revenue reports. This trips people up constantly — they slot by value or by cube and wonder why the pick path is still bad. You're optimizing walking, so rank by how often a hand reaches for the item.
Step 1: pull the only data you actually need
You need one export from your order system: every order line for the last 60–90 days. Two columns do the heavy lifting:
-
SKU
-
Number of orders that SKU appeared on (line-item frequency, not units sold)
Build a simple sheet:
-
Paste your order-line data.
-
Create a pivot that counts distinct orders per SKU.
-
Sort descending by that count.
-
Add a running cumulative percentage column.
-
Draw your zone cut lines where the cumulative curve bends — usually the top ~15% of SKUs cover 70–80% of picks.
That cumulative curve is the single most useful thing you'll produce. When you see that 180 SKUs out of 1,100 account for three-quarters of every pick, the slotting plan basically writes itself.
One caveat that saves grief later: strip out the launch-and-die SKUs before you cut zones. A product that spiked for two weeks during a promo and then flatlined will look like a fast mover in a 90-day window. If you're carrying a lot of intermittent or new items, it's worth reading through your approach to reorder points and safety-stock rules for slow-moving and intermittent SKUs alongside this, because the same demand-lumpiness that messes up replenishment also distorts slotting decisions.
Step 2: draw the pick path before you move anything
A velocity zone tells you where to store things. A pick path tells you how to walk to collect an order. They're related but not the same, and small floors mess this up by solving only the first one.
The goal is a single-direction serpentine: pickers enter at one end, snake through the aisles in a fixed pattern, and exit at the pack station without backtracking. Every location gets a sequence number that follows the walk order — not the aisle number, the walk order.
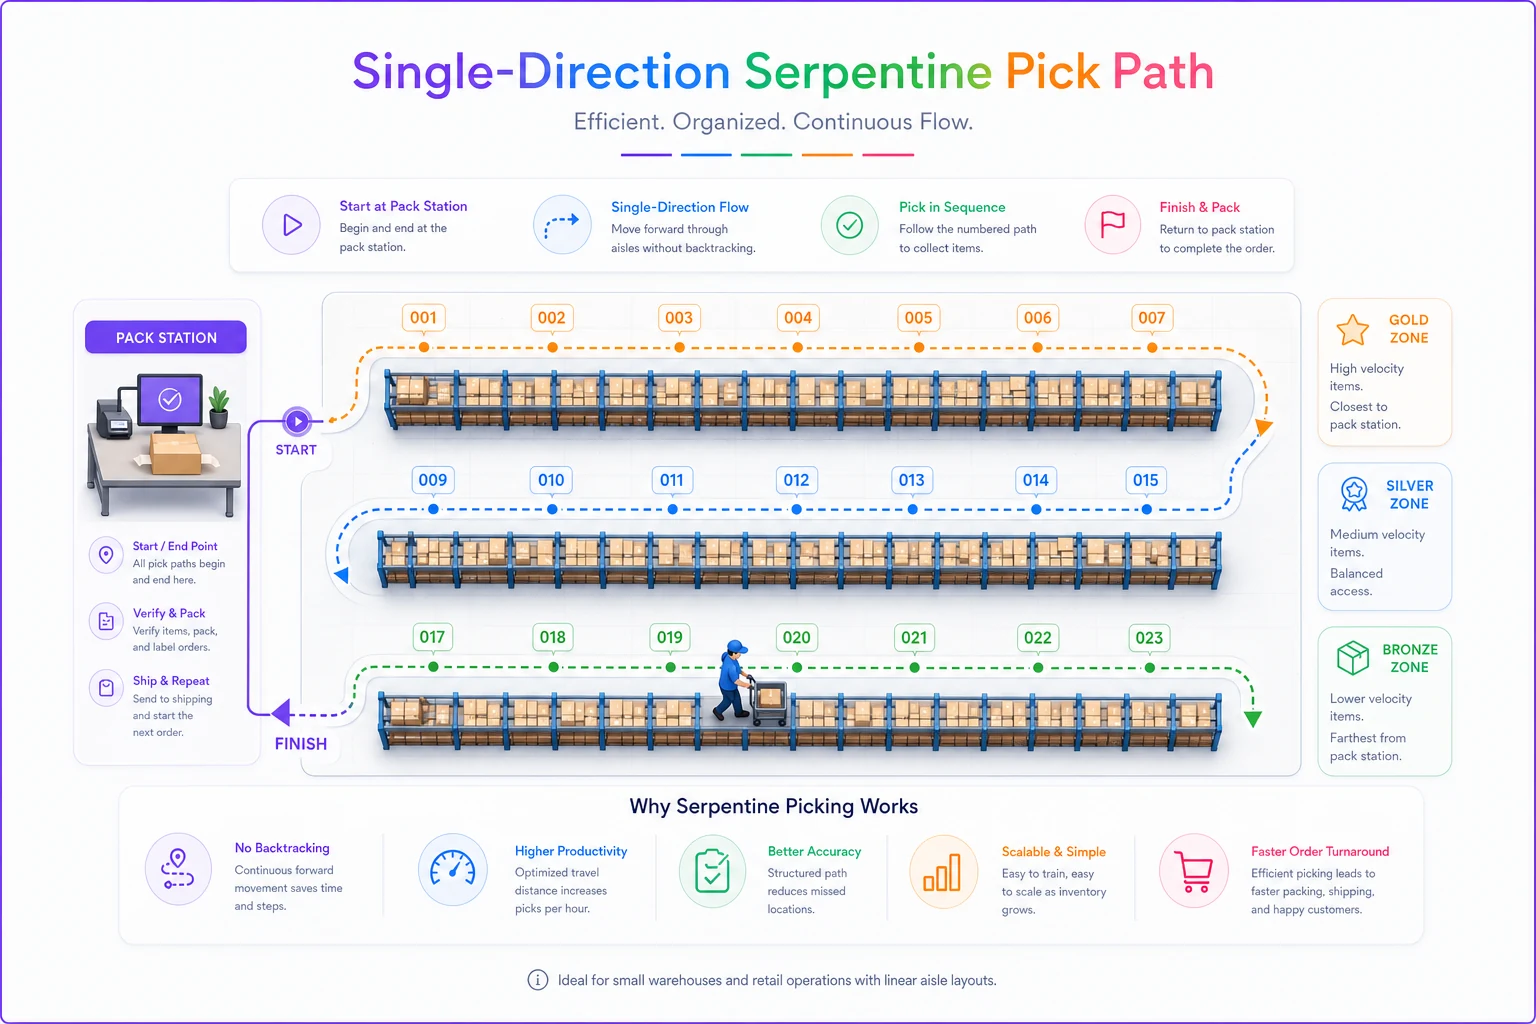
Draw it on paper first. Literally sketch your floor, mark the pack station, and trace the shortest continuous loop that touches every aisle once. Then number your locations along that loop: 001, 002, 003… The pick list gets sorted by location sequence, so items come off the shelf in the order the picker encounters them.
The insight most people miss: your slotting and your pick-list sort order have to agree. If you re-slot beautifully but your pick tickets still print in SKU order or order-entry order, pickers will zig-zag anyway and you'll have gained nothing. The location sequence number is the bridge between the two.
-
Order drops → system (or you) assigns each line a location code
-
Lines get sorted by location sequence, low to high
-
Picker follows the printed list top to bottom, walking the serpentine once
-
Last item lands them at or near the pack station
On a small floor this alone often cuts travel per order by a third or more, before you've even touched velocity zoning.
A real scenario with numbers
A specialty auto-parts distributor running out of about 5,500 sq ft, roughly 1,300 active SKUs, two to three pickers on a normal day. They were doing something like 120–150 orders daily, averaging just under four lines each.
Their fast movers — filters, common belts, a handful of fluids — were spread across the whole building because they'd been shelved by supplier, not by demand. A picker filling a four-line order was walking an estimated 300+ feet once you counted the backtracking.
-
Pulled 90 days of order lines, built the cumulative curve
-
Found 190 SKUs covered ~74% of picks
-
Moved those into a Gold zone within ~25 feet of the pack bench, at golden height
-
Renumbered locations to follow a single serpentine loop
-
Re-sorted the pick tickets to match
After a couple of weeks of settling, average travel per order dropped to somewhere around 170–190 feet. Picks per labor hour went up by roughly a quarter. Nothing dramatic day to day — but across the month it freed up close to half a picker's worth of time, which they redirected to receiving instead of hiring for peak.
The owner's honest reaction was that the biggest surprise wasn't the speed — it was the drop in mis-picks. When top items sit at eye level in a fixed spot, people stop grabbing the wrong SKU off an adjacent shelf.
Seasonal re-slotting: the part everyone skips
Velocity isn't static. The SKU that's Gold in November might be Bronze in March. Small warehouses tend to slot once, feel proud, and then never revisit it — so by the time peak arrives, the zones are describing last season's demand.
You don't need a continuous re-slot. You need a scheduled seasonal check, tied to your actual demand rhythm. For most businesses that's quarterly, with a heavier pass before peak season.
-
Re-pull the pick-frequency curve using the most recent 60 days, not the trailing year — you want current velocity, not annual averages that blur seasons.
-
Flag zone-jumpers
any SKU that moved up or down a full zone since last check.
-
Promote before you demote
move rising SKUs into open Gold/Silver slots first, so incoming demand is served fast.
-
Pull seasonal overstock forward ahead of its window (holiday, back-to-school, summer) and push it back to Zone D once the window closes.
-
Recheck golden-zone congestion — if two people now collide reaching for the same hot SKU, split it into two face locations.
-
Update location sequence numbers for anything you moved, and reprint your pick-path map.
-
Spot-audit 20 random locations against the sheet so drift doesn't quietly accumulate.
A subtle trap: don't re-slot Zone D. Moving dead stock around burns hours for zero pick-time payoff. Touch it only when its space is needed for something faster. The whole point of zoning is that effort scales with velocity — you fuss over Gold, you leave Bronze and Dead mostly alone.
Seasonal re-slotting also pairs naturally with pruning the catalog. If a SKU keeps drifting toward Zone D year after year, it's a candidate for elimination, not relocation — and the exercise in SKU rationalization to cut carrying costs uses almost the same data you already pulled here. Slotting analysis and rationalization analysis feed each other; do them in the same sitting and you save yourself a second data pull.
Measuring it: the before/after spreadsheet
If you can't measure the change, you can't defend the day and a half you spent moving shelves. And the seductive thing about slotting is that it feels better immediately even when it isn't. You need numbers.
Track these before you touch anything, then again two to three weeks after the dust settles:
| Metric | How to capture it | Why it matters |
|---|---|---|
| Avg travel distance per order | Trace 15–20 real orders on your floor map, average the feet | The direct target of slotting |
| Lines picked per labor hour | Total lines ÷ picking hours | The number your GM actually cares about |
| Mis-pick rate | Mis-picks ÷ total lines | Golden-zone slotting usually improves this |
| Golden-zone hit rate | % of picks pulled from Zone A | Tells you if your zoning is right |
| Peak congestion incidents | Rough tally of "two pickers, one slot" waits | Flags over-concentration |
The golden-zone hit rate is the underrated one. If you built Zone A correctly, something like 70–80% of all picks should be coming from it. If your Gold zone is only catching 40% of picks, your velocity data was stale or you slotted by the wrong metric — go back and re-cut the curve.
Give the change two full weeks before you judge it. The first few days after any re-slot are slower, because muscle memory is fighting the new layout. Managers who measure on day two panic and revert. Measure on day fifteen.
When this actually makes sense — and when it doesn't
Do this if: you're a single-site or few-site operation, mostly manual picking, your layout grew by accretion, and you can see with your own eyes that fast movers are scattered. This is the highest-ROI, lowest-cost warehouse project available to a small operator. Two afternoons and a spreadsheet.
Skip or delay it if your order profile is so flat that no clear velocity tiers emerge — some businesses genuinely have even demand across their catalog, and forcing zones onto them just adds admin. The cumulative curve tells you: if it's a gentle diagonal instead of a sharp bend, zoning won't buy you much.
Don't bother if you're picking full pallets or single-SKU orders — there's no multi-line walk to optimize, so pick-path serpentines are irrelevant. Your gains there live in receiving and putaway, not slotting.
One warning for the ambitious: don't try to slot and switch systems and retrain staff in the same week. Change one variable so your measurement means something. If picks-per-hour jump and you changed three things at once, you'll never know which one worked — and you won't be able to repeat it next season.
Keeping the layout honest over time
The quiet failure mode of any slotting project is drift. Six months later, receiving started putting the hot filter in whichever slot was open, an assistant "temporarily" moved something and never moved it back, and the beautiful serpentine has three detours in it. The layout decays back toward accretion.
The fix is boring and it works: a fixed location for every fast mover, a printed map at the receiving bench, and that 20-slot spot-audit in the seasonal checklist. Slotting isn't a one-time cleanup — it's a light quarterly habit. The businesses that hold their gains are the ones that treat the re-slot as a recurring calendar event, not a heroic one-time reorg.
Pin a printed pick-path map at the receiving bench to make correct putaway the default and prevent drift.
This is also where keeping your item and location data in one place stops being a nice-to-have. When pick frequencies, location sequence numbers, and current stock live in the same system instead of three disconnected spreadsheets, the seasonal re-pull takes an hour instead of an afternoon, and the pick list can sort itself into walk order automatically. You can absolutely run this whole plan on spreadsheets — plenty of good warehouses do — but the maintenance is where a proper platform quietly earns its keep, by making the next re-slot cheap enough that you actually do it.
Start with the spreadsheet. Pull 90 days of order lines, build the cumulative curve, find your top 15%, and move those SKUs to within a few steps of your pack station.
Measure the before, measure the after two weeks later, and put a quarterly re-slot on the calendar. That's the entire program — and for most small floors, it's the best day and a half of work you'll do all year.
Ready to optimize your inventory operations?
Join 2,000+ businesses using Listoly to reduce stockouts, save time, and improve order accuracy.