



Most S&OP advice assumes you have a demand planner, a supply planner, a finance partner, and a room full of people arguing about forecast accuracy for two hours. That's not your reality. Your reality is you, maybe a warehouse lead, maybe a part-time bookkeeper, and a spreadsheet that's one bad week away from being out of date.
The usual S&OP playbook doesn't fail because it's wrong. It fails because it's too heavy. By the time a small team finishes pulling data, reconciling it, and formatting anything presentable, the month has already made most of the decisions for them. Stock's gone or it's piled up. The pre-buy window closed. The slow SKU already ate shelf space it didn't earn.
What a small operation actually needs is a cadence that's fast enough to run in half a day, cheap enough to do every single month without dreading it, and focused enough to force three specific decisions: do we pre-buy, do we throttle, or do we markdown. Everything else is noise. This isn't a scaled-down version of enterprise S&OP — it's a different shape entirely.
Why enterprise S&OP collapses on small teams
The enterprise version has five steps spread across a month: product review, demand review, supply review, financial reconciliation, and an executive meeting. Each step has an owner and a prep cycle. It works because the labor is distributed across people whose full-time job is planning.
Collapse that onto two people and you get a predictable failure. The data pulls take so long that by the time you're looking at numbers, they're describing last month's problem. The meeting turns into a status update. And because nobody owns the follow-through, the action items quietly die until next month, when you recreate them from scratch.
The deeper issue is that small teams don't have a demand problem and a supply problem and a finance problem as separate workstreams. They have one coupled problem — cash tied up in the wrong stock — showing up in three places. So the planning process shouldn't mirror three departments. It should mirror the handful of decisions that move cash and service level at the same time.
You're not reviewing your business. You're deciding where the next dollar of inventory spend goes, and which stuck dollars you're willing to release at a loss.
The one-page principle
Everything in this cadence lives on one page. Not one page per SKU — one page, period. If your S&OP artifact runs longer than a single screen, you've recreated the enterprise problem in miniature.
Never run out of stock or overorder again.
Listoly streamlines inventory workflows to keep your business stocked and profitable.
- Real-time stock tracking
- Automated reorder alerts
- Supplier and purchase management
No credit card required
-
Signals — the handful of numbers that changed since last month
-
Decisions — what the three gates say to do, by SKU group
-
Showback — what last month's decisions actually produced, so the process stays honest
That last zone matters more than people expect. Most small-team planning has no feedback loop. You decide to pre-buy, the stock arrives, and nobody ever checks whether the pre-buy paid off. Without showback, the cadence becomes a ritual instead of something that gets smarter over time. That's where most of these setups quietly rot.
The monthly agenda: four blocks, half a day
Run this on the same day each month — the second or third business day, once the prior month closes. Consistency matters more than the exact date. A messy cadence that happens every month beats a perfect one that keeps slipping.
Block 1 — Pull and sanity-check (60–90 min). Grab the five data pulls (below), drop them into the template, eyeball them for obvious garbage. A SKU showing negative on-hand, a cost that 10x'd overnight, a supplier lead time reading 400 days — catch those now, because every downstream decision inherits the bad inputs.
Block 2 — Signal review (30–45 min). Look only at what changed. Not every SKU. The ones whose demand, cover, or lead time moved past a threshold. This is where the RAG status does the filtering for you.
Block 3 — Run the three gates (45–60 min). For each flagged SKU group, walk the pre-buy / throttle / markdown logic and write down the decision plus the owner. This is the actual meeting if you have more than one person.
Block 4 — Showback and assign (20–30 min). Review last month's decisions and their outcomes, update the showback zone, confirm who owns what by when.
Three to four hours total once you've done it a few times. The first couple of cycles run long because you're building the muscle and cleaning up data. That's normal.
Run the cadence the same day each month; consistency matters more than the exact date.
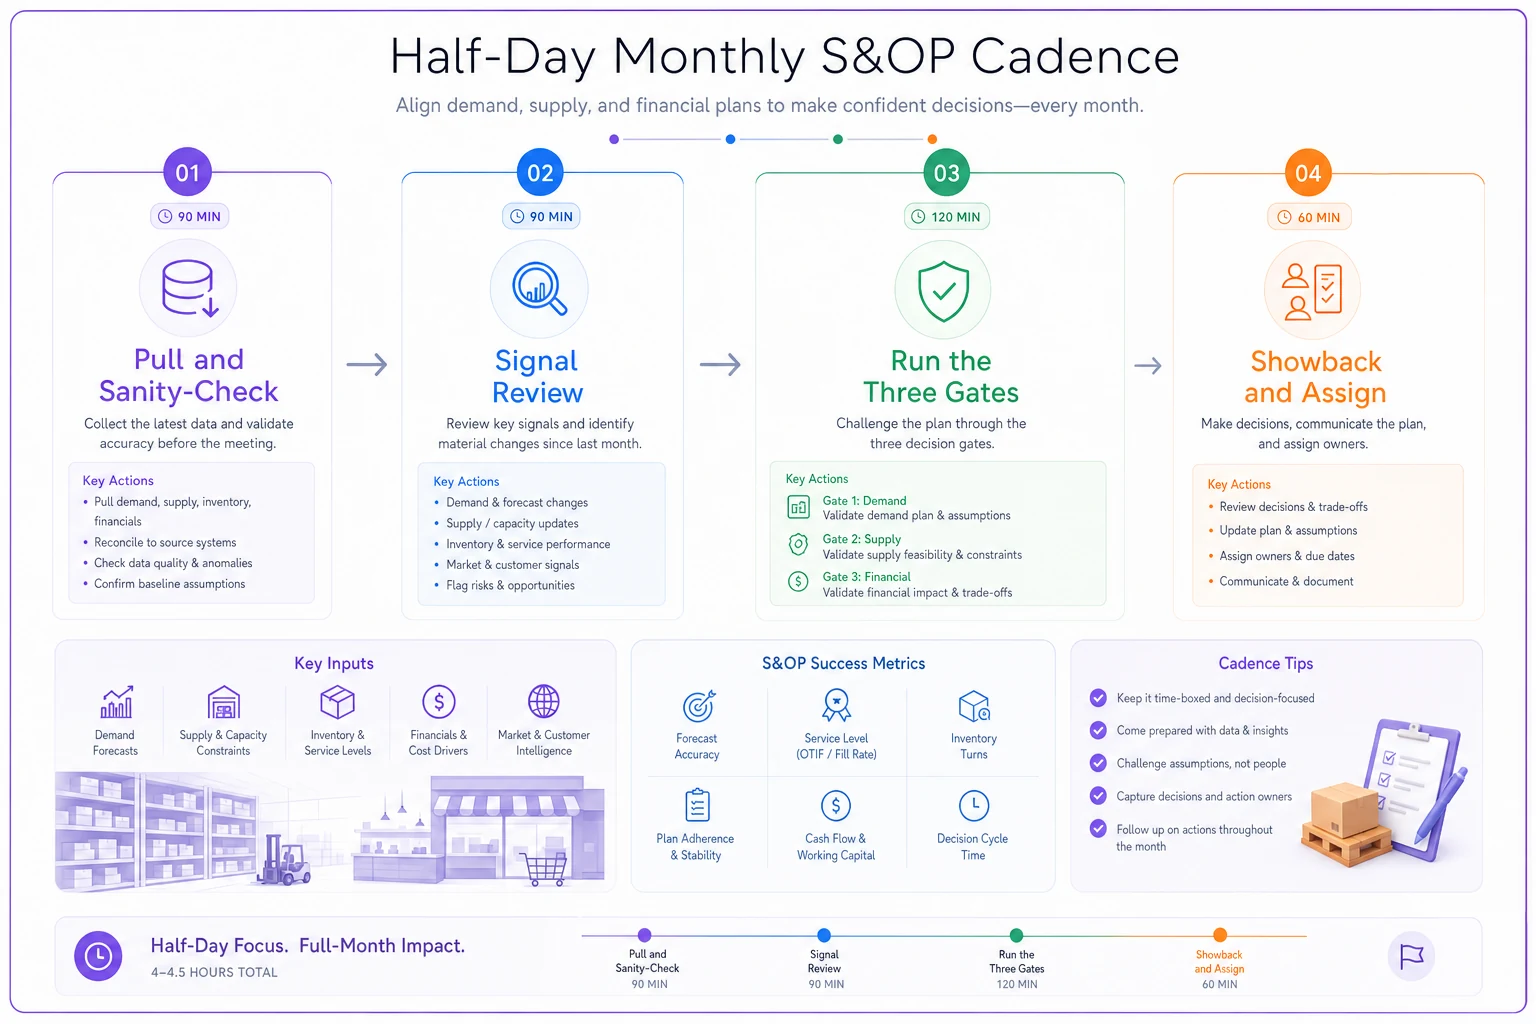
This flow visualizes the half-day cadence so you can see how the blocks feed each other and where the decisions happen.
The five required data pulls
The whole cadence runs on exactly five pulls. Not fifteen. Five. Every one earns its place because it feeds at least one of the three gates. If a report doesn't change a decision, it doesn't belong in the pack.
| # | Data pull | What it feeds | Minimum fields |
|---|---|---|---|
| 1 | Demand signal | All three gates | SKU, units sold last 4 & 13 weeks, trend direction |
| 2 | On-hand + on-order position | Pre-buy, throttle | SKU, on-hand units, open PO units, ETA |
| 3 | Lead time + supplier status | Pre-buy | SKU, current lead time, supplier risk flag |
| 4 | Cover / weeks-of-supply | Throttle, markdown | SKU, on-hand ÷ weekly run rate |
| 5 | Margin + aging | Markdown | SKU, unit margin, days-on-hand of oldest stock |
A few things worth flagging from how these actually behave in practice.
The demand pull needs two windows, not one. The 4-week window catches recent movement; the 13-week window keeps you from overreacting to a single hot or dead week. When they disagree sharply — say the 4-week run rate is double the 13-week — that disagreement is itself a signal worth flagging. If your demand history is thin, the framework in a low-data inventory forecasting framework for small businesses pairs well with this cadence.
Cover is a derived pull, not a raw one. You compute it from pulls 1 and 2. It gets listed separately because two of the three gates read it directly, and you want it sitting right there on the page rather than doing mental math mid-meeting.
Aging on pull 5 is the one people skip, and it's the one that saves margin. Average days-on-hand hides the problem. You want the oldest cohort — the stuff that's been sitting since before last quarter — because that's what the markdown gate actually acts on.
If pulling these five cleanly every month is a struggle, the problem usually isn't the cadence. It's that your underlying numbers don't agree with each other. Most S&OP-lite setups that stall do so here. The whole thing assumes your pulls describe the same reality — which is really a question of how well your metrics connect to decisions in the first place. That's worth building deliberately; designing an inventory KPI system that turns metrics into decisions covers the underlying wiring.
RAG outputs: let the colors do the triage
You can't review 800 SKUs in a 45-minute block. You shouldn't try. The RAG layer exists so that 90% of your catalog is green and you never look at it.
-
Green — cover sits inside the target band, demand trend is flat or expected, no supplier flag. Do nothing.
-
Amber — one threshold breached. Cover drifting toward the edge, or demand moved, or lead time ticked up. Watch, maybe act.
-
Red — two or more thresholds breached, or any single breach severe enough to force a gate decision now. Acts this cycle.
A worked example:
> SKU HW-240, a mid-velocity hardware item. 13-week run rate: ~55 units/week. 4-week run rate: ~90 units/week — demand climbing. On-hand: 310 units, no open PO. Cover against the recent run rate is about 3.4 weeks. Supplier lead time just moved from 3 weeks to 5 weeks. > > RAG reads red: demand accelerating and lead time extending and cover sitting below the replenishment horizon. No single number is catastrophic, but together they point to a stockout roughly two weeks out if the trend holds. This SKU goes straight to the gates.
What the RAG did was take you from "review everything" to "review the eleven reds and glance at the ambers." On a two-person team, that difference is the whole ballgame — it's the gap between a cadence you actually run and one you abandon by March.
The three decision gates
Every red — and the ambers you choose to touch — runs through three gates in order. The order matters: pre-buy and throttle are about future commitment, markdown is about releasing past mistakes. Run them front to back.
Gate 1 — Pre-buy
Question: Should we commit cash to extra inventory now, ahead of need?
Fires when: demand trending up AND (lead time extending OR a known cost increase coming OR supplier risk rising). HW-240 above is a textbook pre-buy candidate.
The check that stops dumb pre-buys: cover-after-arrival. If you pre-buy and the stock lands you at 20+ weeks of cover on a SKU with a wobbly trend, you've converted a stockout risk into a cash trap. The pre-buy gate should carry a hard ceiling — something like "don't pre-buy past X weeks of cover unless there's a confirmed cost event." The mechanics of sizing those buys, split tranches, and storage trade-offs are worked through in a compact seasonal pre-buy playbook.
Gate 2 — Throttle
Question: Should we slow or pause inbound on something?
Fires when: cover is drifting high, demand is softening, or you've got an open PO that no longer makes sense against the current run rate.
This is the quiet gate. Pre-buy feels productive, markdown feels urgent, but throttle is where small teams leave the most money on the table — because doing nothing on an open PO feels like the default. It isn't. A worked case:
> SKU AP-18, seasonal apparel accessory. 13-week run rate was ~40/week; last 4 weeks it's fallen to ~18/week — season fading. On-hand: 260 units. Open PO: another 300 units, ETA in three weeks. At the current run rate that incoming PO pushes you to roughly 30+ weeks of cover heading into the slow season. > > Throttle decision: contact supplier, attempt to cut the PO to 100 units or push the ETA out. Even partial success saves hundreds of units of dead cash and the shelf space they'd occupy.
The throttle gate only works if someone actually looks at open POs against current demand. That's why pull #2 includes on-order position. Without it, throttle is invisible.
Gate 3 — Markdown
Question: What do we release at a loss to free cash and space?
Fires when: aging crosses a threshold AND cover is far above target AND demand is flat-to-declining. All three conditions. Markdown is the last resort, so the gate is deliberately strict.
> SKU KT-07, a kitchen SKU. Oldest cohort has been on-hand 190+ days. Cover against current run rate: ~40 weeks. Demand flat. Unit margin is healthy at full price — which is exactly why nobody's marked it down. It feels like a good product. > > Markdown decision: step it. First a modest cut to test elasticity, then a sharper one if units don't move within a set window. The goal isn't to maximize margin on KT-07 anymore. It's to convert frozen cash back into working capital before it ages further.
Why the gates run in this order: a SKU can legitimately trip pre-buy logic on recent demand and be sitting on an old aging cohort at the same time — fast new variant, dead old variant. Running the gates in sequence forces you to resolve the commitment question before the release question, so you don't accidentally pre-buy more of something you're simultaneously marking down.
The owner matrix
Decisions without owners evaporate. On a tiny team the matrix is small, but writing it down is what converts the meeting into action.
| Gate / task | Owner | Backup | Deadline rule |
|---|---|---|---|
| Pre-buy PO creation | Buyer / owner | — | Within 2 business days of cadence |
| Throttle (PO cuts, ETA pushes) | Buyer | Warehouse lead | Before next inbound cutoff |
| Markdown execution | Owner / merchandiser | — | First price change within 1 week |
| Data pulls + pack prep | Whoever owns the system | — | Day before cadence |
| Showback update | Facilitator | — | During cadence |
The rule that makes this stick: every red SKU leaves the meeting with exactly one name next to it. Not a team, not "we." A name. When two people own something on a two-person team, nobody does.
Showback: the one-page honesty check
Each month, before you make new decisions, you look at what last month's decisions produced. This is what separates a cadence that compounds from one that slowly decays.
-
Pre-buys — did the demand we bought ahead of actually materialize? Or are we sitting on cover we justified with a trend that fizzled?
-
Throttles — did we successfully cut or delay, and did it save the cash we projected?
-
Markdowns — did the marked-down stock actually clear, and at what realized margin?
A realistic showback line: "Pre-bought 400 units of HW-240 in March on a rising trend. Trend held — sold through at expected rate, zero stockout days, no excess cover. Good call." And an honest losing line: "Throttled AP-18 PO down to 100 in March. Right move — would've been sitting on ~20 weeks of cover otherwise."
You want losing lines in there too. A showback with nothing but wins means someone's grading their own homework. The point isn't to look good. It's to calibrate your thresholds so next month's gates fire a little smarter.
A real scenario
A regional homewares retailer — two storefronts plus a small ecommerce channel, run by the owner and one operations person handling buying and the warehouse. Roughly 600 active SKUs. Before this cadence, planning was reactive: reorder when something looks low, discover dead stock during physical counts twice a year.
The pattern they lived with: stockouts on best sellers during busy months, and a back room slowly filling with slow-movers nobody decided to deal with. Cash was perpetually tight, mostly because too much of it sat on shelves as aging stock.
They started running the half-day cadence on the third business day of each month. First two cycles were rough — the data pulls didn't agree, and cleaning on-order position took real work. By the third cycle it was humming.
-
Stockout days on their top ~40 SKUs dropped noticeably — the pre-buy gate caught two lead-time extensions before they bit.
-
They cut or delayed open POs worth several thousand dollars on softening SKUs they'd previously have let land on autopilot.
-
The markdown gate cleared a chunk of aged back-room stock they'd been emotionally unable to touch, turning frozen cash back into working capital.
No dramatic revenue hockey stick. The win was subtler: cash stopped getting trapped, and the busy-season stockouts that used to cost them sales mostly stopped happening. The operations person described it as finally feeling like they were making decisions instead of just reacting to whatever was in the warehouse.
Where a system helps — and where it doesn't
You can run this in spreadsheets. Plenty of small teams do, and for the first year it's often the right call because you're still learning which thresholds fit your business.
The spreadsheet version strains in a few specific places. Pulling five reports from different systems and reconciling them by hand eats most of Block 1. On-order position and aging are exactly the fields that go stale fastest with manual pulls. And RAG coloring by hand across 600 SKUs is tedious enough that people start skipping it — which kills the triage that makes the whole cadence fast.
Operational platforms that pull your on-hand, on-order, demand windows, and aging into one place — and flag the reds automatically — remove the two blocks most likely to make you abandon the cadence: the data wrangling and the triage. The decisions stay human. The gates still need your judgment about trends, suppliers, and how aggressively to mark down. What the software handles is the grunt work that makes a small team quietly stop running the process by summer.
When manual is fine: fewer than ~150 active SKUs, stable demand, one system of record, and you genuinely don't mind the spreadsheet work. When it isn't: multiple sales channels, frequent open POs, aging that's hard to see in your current reports, or the cadence keeps slipping because prep is painful. If you've abandoned this process once already, the prep was almost certainly why.
When this cadence is the wrong tool
Not every operation needs this.
-
Very few SKUs, very stable demand — if you reorder the same twelve things on the same rhythm and nothing surprises you, a monthly S&OP cadence is overhead you don't need.
-
Pure make-to-order with no stock — there's no inventory position to plan against; your constraints are capacity and lead time, which is a different problem.
-
Teams that won't commit to the owner matrix — if decisions won't get a single name attached and a deadline, the cadence degrades into a monthly status meeting, which is worse than nothing because it costs time and produces no change.
One softer warning: don't bolt on more gates. The temptation, once this works, is to add a fourth and fifth decision. Resist it. The power here is that three gates cover the decisions that actually move cash and service level. A fourth gate is usually someone's pet metric sneaking back in, and it slowly drags the cadence back toward the enterprise version you were escaping.
Closing thought
The reason tiny teams avoid S&OP isn't that they don't believe in planning. It's that every version they've seen was built for an org chart they don't have. Strip it down to its actual job — route the next inventory dollar and release the trapped ones — and the whole thing fits on one page and half a day.
Run it the same day every month. Pull the five. Let the colors triage. Walk the three gates. Put one name on every decision. Check last month's results before you make new ones. Do that for two quarters and the cadence stops feeling like a meeting and starts feeling like the thing that keeps your cash from freezing on a shelf.
The reason tiny teams avoid S&OP isn't that they don't believe in planning. It's that every version they've seen was built for an org chart they don't have. Strip it down to its actual job — route the next inventory dollar and release the trapped ones — and the whole thing fits on one page and half a day.
Run it the same day every month. Pull the five. Let the colors triage. Walk the three gates. Put one name on every decision. Check last month's results before you make new ones. Do that for two quarters and the cadence stops feeling like a meeting and starts feeling like the thing that keeps your cash from freezing on a shelf.
Ready to optimize your inventory operations?
Join 2,000+ businesses using Listoly to reduce stockouts, save time, and improve order accuracy.